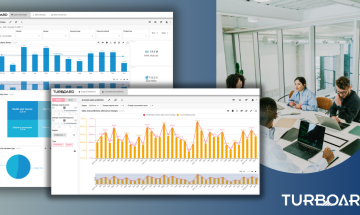
Easily connect to your data sources, prepare data, create reports and pixel-perfect visualizations using
![]() 's intuitive drag & drop interface
's intuitive drag & drop interface
Go beyond the limits of data visualization and experience the full potential of business intelligence with our add-on modules
DATA
PROFESSIONALS
Analyze data and create pixel-perfect visualizations in just a few clicks.
Enhance your data science career using TURBOARD's built-in Python-powered technology.
MANAGERS
Access up-to-date data and insights to make more informed decisions to drive your business success.
Maximize revenue and profits by identifying opportunities for growth and improvement.
FEATURES OF TURBOARD
Ease of Use
Start playing with your own data within minutes of your first hands-on experience. No technical background is required. All you need is curiosity.

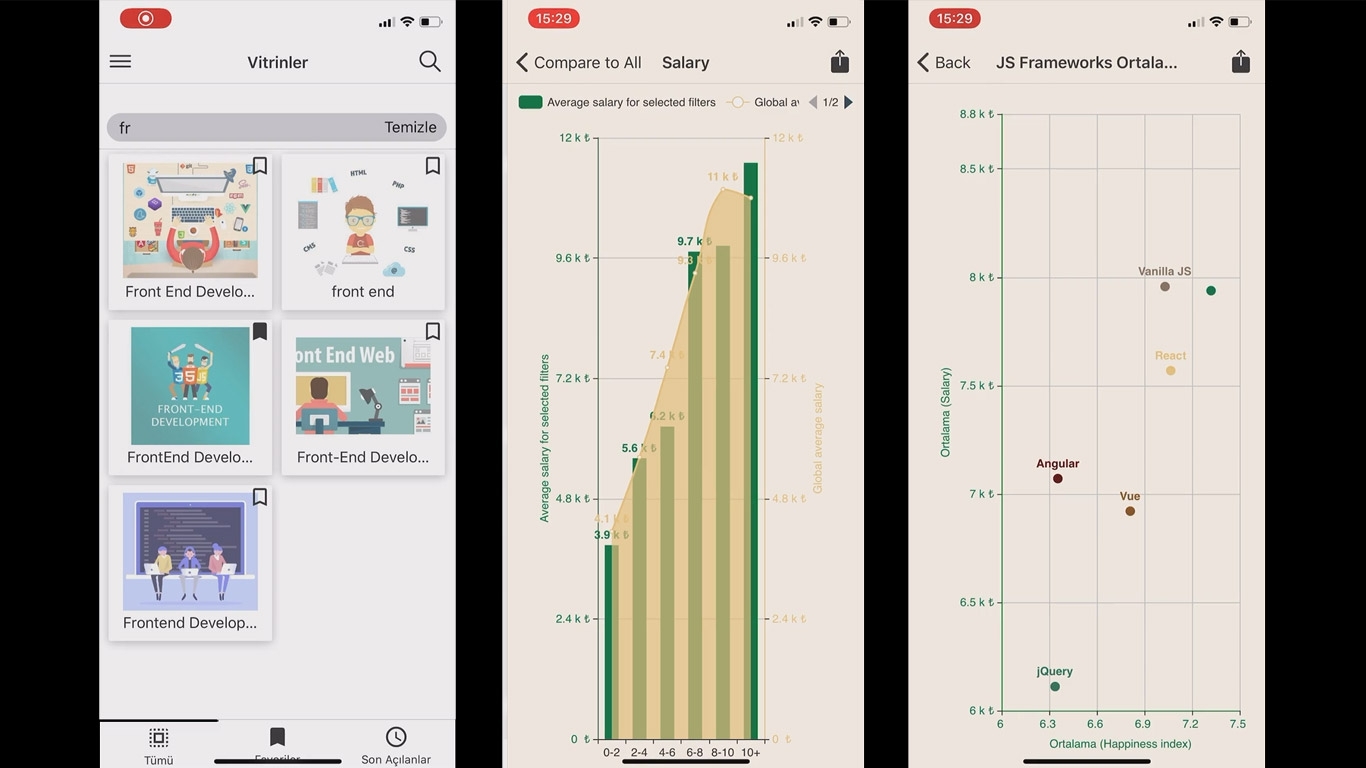
Native Mobile
Install TURBOARD on your mobile device and test it today.
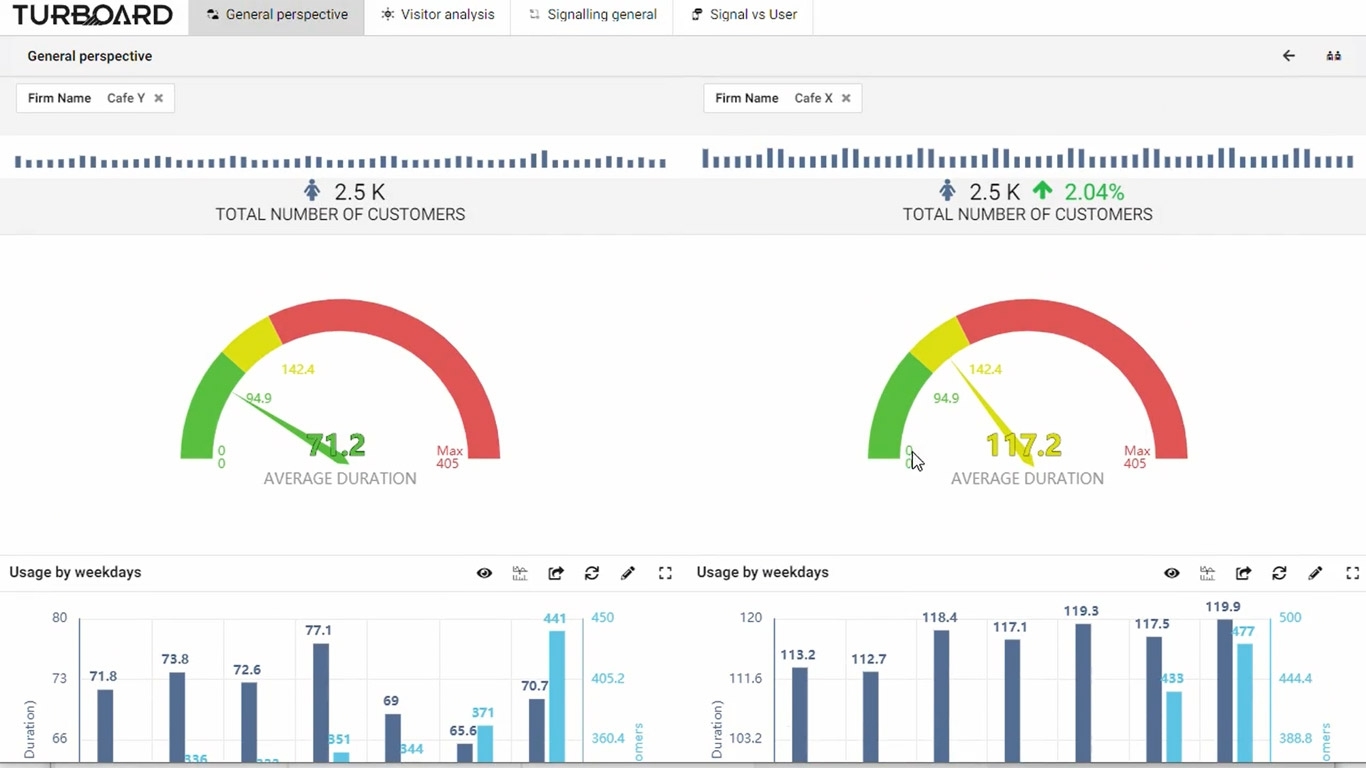
Cloning Dashboards (Patented)
With one click, clone your dashboard for side-by-side comparison to see the effects of different filters.
Embed Into Your Application
Upsell your software by adding compelling analytic visualizations. Easy integration of authentication and authorization functions for OEM usage within ERPs, CRMs, HRs and other similar online systems.
Extended Slicing & Filtering Capabilities
Slice and dice your data without a need for a preprocess, turn almost all dashlets to slicer. If there is no field in the database, create your filters using SQL.
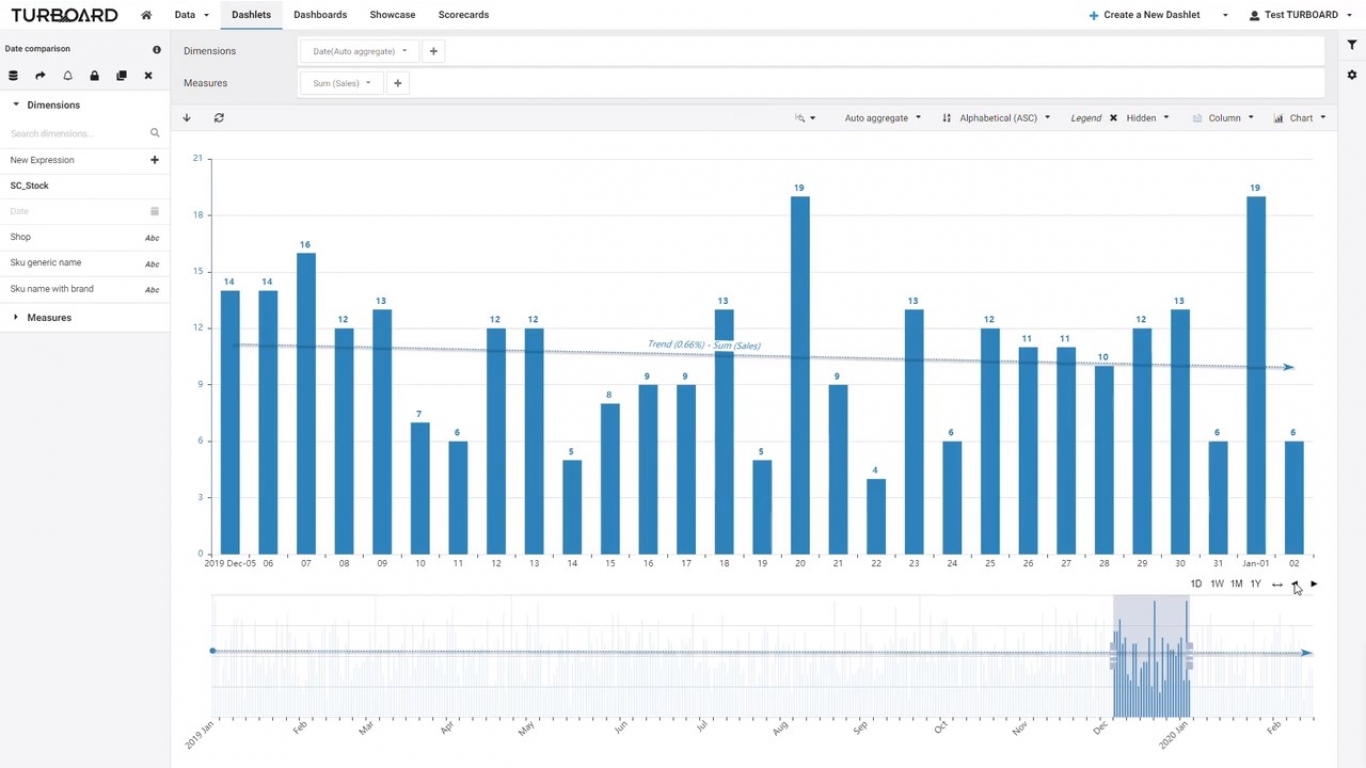
Vis-a-Vis Date Comparisons
The date field is special for TURBOARD. It will auto-adjust the aggregate level and you have the ability to set relative date and do vis-a-vis comparison like to-date comparison with last month, same month last year, etc.

SUCCESS STORIES
We strive to make sure our clients are completely satisfied with our platform, services and support.


Compare us with the alternatives and see how TURBOARD will be a lifesaver for you and lucrative for your business.
LEARN MORECUSTOMIZED BUSINESS INTELLIGENCE SOLUTIONS
FOR EVERY INDUSTRY
How can your company be empowered by unlocking full potential of your data in your sector?


BLOGS
[Article] How TURBOARD Keeps Its Performance on Top
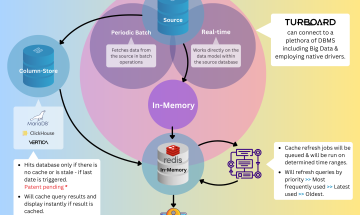
Challenges such as data latency, inconsistent data formats, low-performance data sources, and the need to process large volumes of data can hinder the performance of BI tools. We understand the complexities involved...
[Article] Sales Analytics: Drive Sales with TURBOARD
If you're diving into the world of sales, you've likely come across the term “sales analytics”. But what does it really mean? At its core, sales analytics is the process of using data analysis to understand sales trends, predict future performance...

[Article] TURBOARD vs. OBIEE: A Comprehensive BI Tool Comparison
For years, Oracle Business Intelligence Enterprise Edition (OBIEE) has been a preferred data analytics platform for many organizations. However, as the Business Intelligence (BI) sector advanced...
To reveal striking insights hidden in your own data, discover ![]()
DATA PROFESSIONALS
You need to produce report after another with perfect timing and all should be ready down to meticulous details.
We alleviate your burden with a platform providing a large toolset and with a team that will listen to your needs and be with you right at the moment not later on.
- Ease of use,
- Fanatical support,
- Data science tools bundled within the platform that will turn you into a distinguished data scientist.
MANAGERS
You invested in data for years, are you willing and ready to use it to reduce costs, increase revenue or to improve your processes? Are your current BI tools and the service that you get enough for your necessities and affordable?
Choose TURBOARD because:
- Make money through TURBOARD using favorable conditions on OEM licensing. Upsell your software with slick analytics,
- An established company with 80+ employees 15+ years experience implementing Business Intelligence and providing continuous services,
- No overpriced service fees, in addition to providing know-how transfer as much as possible to keep your team up-to-date,
- Get market and competitive intelligence to drive decision making via connection to open data sources,
- Reduced cost per user based on volumes which is unbeatable when it comes to hundreds of users.
Past
Since 2004, E-Kalite (producer of TURBOARD) has thrived on data monetization and visualization projects starting specifically on the pharmaceutical sector based in the USA. Since 2011, continuously being supported by the Turkish Science and Technology Agency (TUBITAK) and exempted from taxes in a renown university campus, we have built a decent business intelligence software.
Today
With more than 100 professionals, we are a flourishing team eager to work on your data needs. With our battle-proven software TURBOARD and expansive know-how, we are serving reputable institutions and companies.
Future
In our master-plan for 2022, we aim to attain the goal of augmented analytics within business intelligence. Tidbits of data may seem to appear random to even the most astute teams of experts. TURBOARD will use several data science methods interchangeably to different segments of data to reach an interesting pattern.
© 2004-2024 ![]() All Rights Reserved.
All Rights Reserved.