- Data preparation and pre-migration steps,
- Gathering requirements and prioritizing,
- Planning for deployment,
- Creating and getting approval of dashboards and reports,
- Deployment followed by continuous support and monitoring.
As our clients are the center of our world, we want our clients to know that their project with us is our top priority and that we recognize and value the fact that the service we are offering is extremely important to their company's success.
As the project begins, we provide the following resources on an hourly or daily rate basis according to the clients’ needs and the scope of the project.
- Business Analyst,
- Data Warehouse Consultant,
- Business Intelligence Developer,
- Project Manager,
- TURBOARD Trainer.
Additionally, after each project goes live, clients are transitioned over to our support group so that any occurring issues are resolved in a timely manner.
Generally, instances of TURBOARD run on servers reside within our customers' premises. However, TURBOARD also offers public/private cloud options.
TURBOARD has integrations with commonly used login systems.
Authentication and login of users can be done via any of the below methods:
- OAUTH 2.0 to enable users to login via e-government, Twitter, Facebook, etc.
- LDAP/Active Directory,
- SSO (Single Sign On) infrastructure,
- External table integration.
Hundreds of thousands of users from an external table can be transferred by using a configurable configuration interface for authorization purposes.
Additionally, TURBOARD offers advanced authorization features, such as masking data, applying row and column based restrictions, receiving and syncing authorizations from other application databases, and flexible grouping options (on user and/or group levels).
Check this presentation for more details on Authentication and Authorization.TURBOARD allows you to create data views by uploading excel files (.xlsx and .csv).
You can also easily update the data views that you created from the files you uploaded, provided that the excel sheet structure (file name and the column names in the file, etc.) remain the same.
Refer to our Knowledge Base, or check this presentation for more details on Data Sources.
Reports, dashlets and dashboards in TURBOARD can be exported in various formats (.ppt, .docx, .xlsx, .jpeg, .png, etc.) and can be shared via e-mail as well.
You can select the format you want to export by clicking the “Export” icon on the relevant report screen (any dashlet and/or dashboard).
Yes, with TURBOARD’s built-in Python-powered technology, there is no need to transfer output data to carry out data science and analytics operations using other tools.
You don't even need to know anything about Python. All you need to know is how to use a mouse.
Click this link for more details.
TURBOARD has comprehensive and rich options for filtering. While there was no autocomplete feature in Google yet, the first visualization software we developed in 2004 consisted primarily of autocomplete and filtering.
For example, by typing the name of a physician in Turkey, you can easily access that physician's antibiotic report. And since the filter cache is kept in-memory (in Redis), it does not negatively impact the overall system performance.
Filtering can be applied on dashboards and dashlet level as well, with the ability to easily set combined filters.
You can slice and dice your data without pre-processing it, and turn almost every dashlet into a slicer (filter). You can even create your own filters using SQL if there is no field for the required filter in the database.
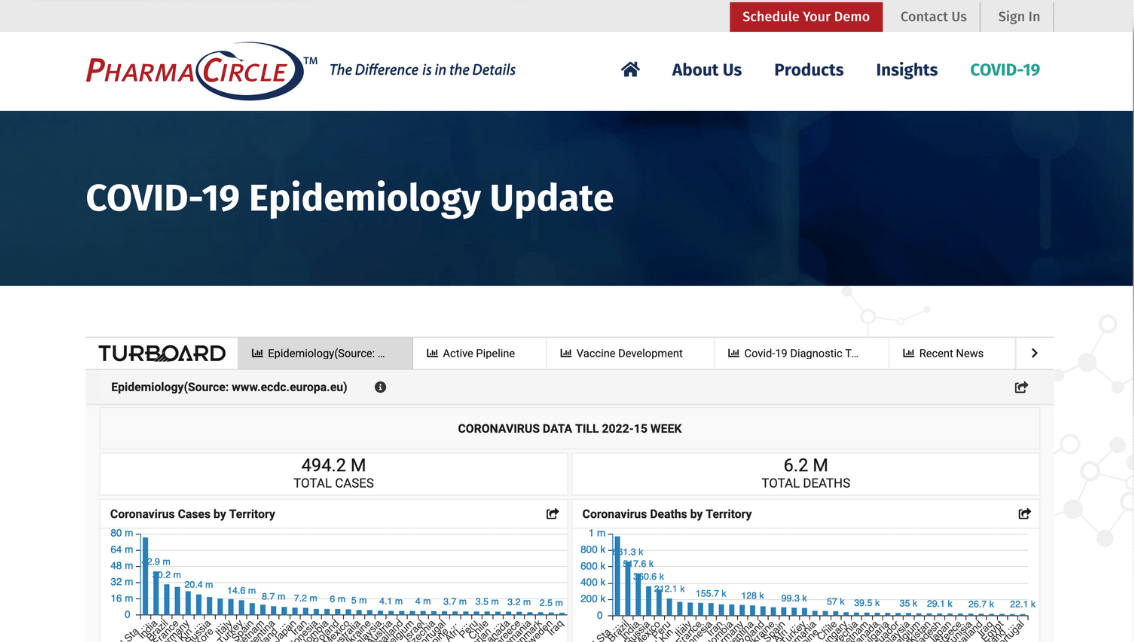
Yes, EMB-S add-on is used for this purpose. You can seamlessly integrate TURBOARD into your products (websites, portals, mobile/desktop applications) regardless of your tech stack. Any object can be embedded such as a single chart, a dashboard, a whole showcase, or a pivot table, etc.
Also, without any manual effort, all users in master product’s can use TURBOARD with their same password. Alternatively, standard OAuth 2.0 authentication can be used. You can see an embedded use case screenshot below.
No. Quite the opposite, it will decrease. Because TURBOARD is designed as an easy to use self-service BI tool. With self-service capabilities of TURBOARD, users can create reports and dashboard based on ad-hoc requests. This ability frees up IT resources and allows them to focus on tasks that require technical expertise.
On your regional map (SVG map), TURBOARD allows collective viewing for cities grouped for a variety of reasons. For example, the Sales Region, Production Region, etc. in which you will be able to follow them as groupings on the map.
To utilize this feature, you can set “Synonyms” for the cities that you want to group on the relevant map from the “Administration” panel under “Maps” section. Refer to our Knowledge Base for more details.Yes. You can view the map mats you create with Esri maps in TURBOARD.
In addition, regional maps can be produced by converting SHP or SVG formats to GeoJSON. You can also visualize the data held as SDO_Geometry in Oracle (without latitude longitude conversion) in TURBOARD.
Check this presentation for more details on TURBOARD’s Mapping options.
TURBOARD allows you to use different tables in a single data view by associating them with each other.
To do so, go to the “Administration” panel > click on the “Data Sources” tab > select the relevant Database and click the “Define Foreign Keys” button at the bottom of the database window.
A new window opens where you can combine and link the nodes from different tables by selecting them and using the drag and drop method.
For this change to take effect, make sure to enter all the tables you have associated when you create the data view.
No issue will occur if SAP HANA migration has been completed. However, there is a connectivity problem when using the standard (pre-HANA) SAP.
Connecting to legacy SAP's data is not possible for two reasons:
- A license is needed to connect from within SAP, in case its database is Oracle for example.
- Even if the connection somehow succeeds, tens of thousands of tables may be in use. Understanding which table does what and how it relates to others requires special expertise.
For those reasons, TURBOARD can be connected with the driver as in other business intelligence softwares.
There are 3 ways to connect to legacy SAP database with a Business Intelligence tool:
- Via an online driver: if a 4-core CData SAP driver is purchased, business intelligence queries are sent directly to SAP.
- Via an offline driver: this is suitable for routine (hourly or daily) operations rather than continuous work. It is installed on a computer and transfers data with timed tasks.
- Using it with other migrations to Excel: SAP data can also be visualized by exporting the data from SAP to excel files, then exporting these excels to TURBOARD with a simple script.
TURBOARD just connects and combines data from various data sources and does not store any of it. It will simply visualize and aggregate the data on top of your existing databases.
Exceptions are in the following cases:
- There is an express ETL feature within TURBOARD. If you'd like to use it, then the data from the original source will be fetched and dumped to MariaDB Columnstore (not a proprietary database, opensource).
- If the data is not in the database but in an excel file, then the data will be dumped again to MariaDB Columnstore.
When sorting and aggregation queries are made in TURBOARD, these queries go to the database in cases where it is needed and according to the working principle.
If it is not necessary to fetch the data from the database, these queries are made on the client side only. For example, if all dimensions are taken in a pivot dashlet, reordering will not call the database again.
To reveal striking insights hidden in your own data, discover ![]()
DATA PROFESSIONALS
You need to produce report after another with perfect timing and all should be ready down to meticulous details.
We alleviate your burden with a platform providing a large toolset and with a team that will listen to your needs and be with you right at the moment not later on.
- Ease of use,
- Fanatical support,
- Data science tools bundled within the platform that will turn you into a distinguished data scientist.
MANAGERS
You invested in data for years, are you willing and ready to use it to reduce costs, increase revenue or to improve your processes? Are your current BI tools and the service that you get enough for your necessities and affordable?
Choose TURBOARD because:
- Make money through TURBOARD using favorable conditions on OEM licensing. Upsell your software with slick analytics,
- An established company with 80+ employees 15+ years experience implementing Business Intelligence and providing continuous services,
- No overpriced service fees, in addition to providing know-how transfer as much as possible to keep your team up-to-date,
- Get market and competitive intelligence to drive decision making via connection to open data sources,
- Reduced cost per user based on volumes which is unbeatable when it comes to hundreds of users.
Past
Since 2004, E-Kalite (producer of TURBOARD) has thrived on data monetization and visualization projects starting specifically on the pharmaceutical sector based in the USA. Since 2011, continuously being supported by the Turkish Science and Technology Agency (TUBITAK) and exempted from taxes in a renown university campus, we have built a decent business intelligence software.
Today
With more than 100 professionals, we are a flourishing team eager to work on your data needs. With our battle-proven software TURBOARD and expansive know-how, we are serving reputable institutions and companies.
Future
In our master-plan for 2022, we aim to attain the goal of augmented analytics within business intelligence. Tidbits of data may seem to appear random to even the most astute teams of experts. TURBOARD will use several data science methods interchangeably to different segments of data to reach an interesting pattern.
© 2004-2024 ![]() All Rights Reserved.
All Rights Reserved.