Like-for-like sales
Daily sales by store, region and category compared with the same days last month and last year using Vis-a-Vis, without building time-intelligence formulas.
TURBOARD brings point-of-sale, e-commerce, stock and promotion data into one governed model, so merchandising, store operations and finance work from the same sales and margin figures.
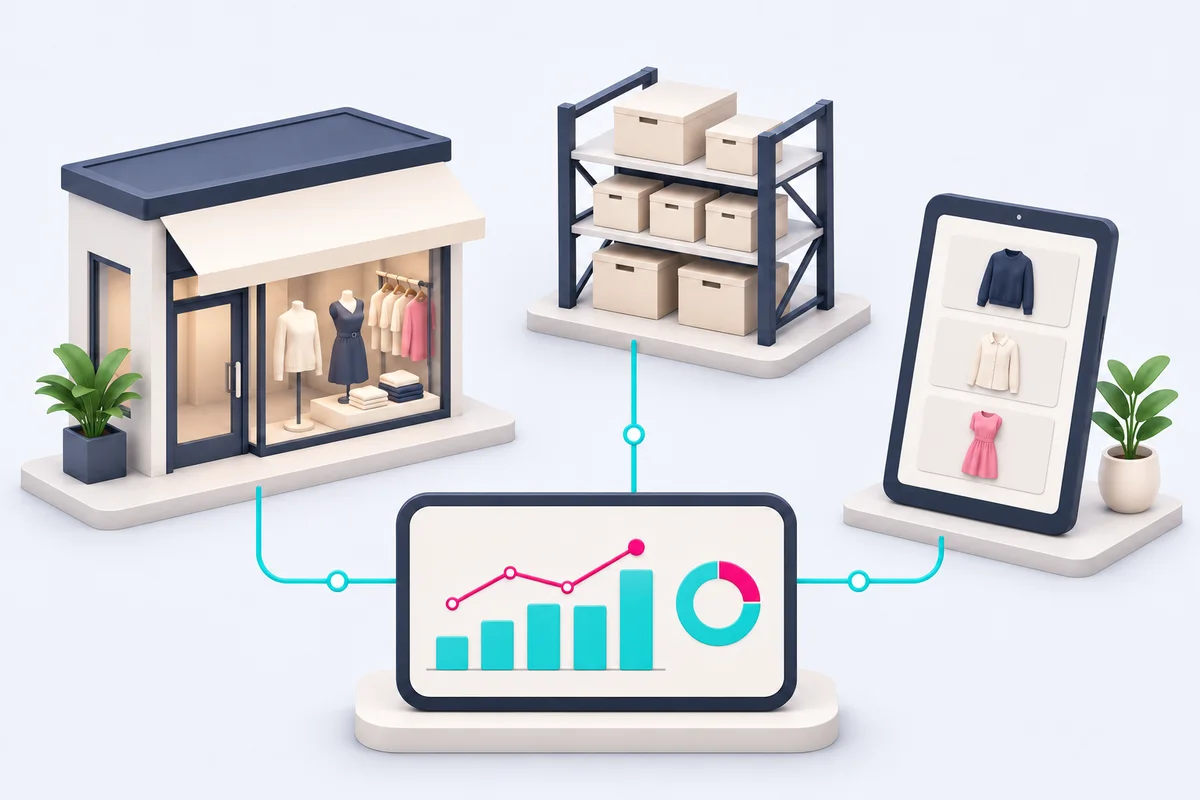
Sales arrive from tills, the web shop and marketplaces; stock from warehouses and stores; costs and promotions from ERP and merchandising systems. Each team builds its own report, and comparing this month with last year means arguing over which days, which stores and which calendar. By the time a weak category or an overstocked store is visible, the season has moved on.
TURBOARD connects these sources once and calculates sales, margin, stock cover and sell-through from one set of definitions. Like-for-like comparisons are a setting, not a spreadsheet: Vis-a-Vis lines up the same days of last month or last year automatically. Store managers, category managers and the executive team see the same figures, each limited to what they are authorised to see.
Daily sales by store, region and category compared with the same days last month and last year using Vis-a-Vis, without building time-intelligence formulas.
Gross margin after discounts and returns by product, category, brand and store, with drill-down from total to item.
Current stock, days of cover, sell-through and slow movers by store and warehouse, highlighted by conditional formatting when cover runs low or high.
Stores ranked by sales per square metre, conversion, basket size and target achievement, with stores mapped by the GIS-S module.
Stores, web shop, marketplaces and mobile app compared on sales, margin, returns and basket, so channel decisions rest on the same data.
Uplift, margin impact and stock effect of each promotion, compared period against period and store against store.
This month against last year compares different weekdays and store counts, and every team calculates it differently.
Comparable periods are aligned day for day as a setting, so every report compares the same way.
Out-of-stocks and overstock surface only after lost sales or forced markdowns.
Stock and sell-through refresh with the data, and scheduled reports send exceptions to each store and buyer.
Campaigns run every week, but nobody can say which ones paid for themselves after margin.
Uplift and margin per promotion compared with the base period, with patented dashboard cloning for side-by-side scenarios.
Each store, region and buyer needs its own report, and maintaining them by hand does not scale.
Row-level permissions and scheduled distribution send each recipient only their own stores and categories.
JAS, the AI assistant built into TURBOARD, answers from the same governed retail model your reports use. Ask a question and she finds the relevant data, builds the chart and edits it on command. With JAS Explain and personas, a sales dashboard comes with an interpretation written for a store manager or for the board.
Explore JAS capabilities →We will connect a sample of your sales and stock data and show how TURBOARD and JAS deliver like-for-like answers.