Customer × mode margin
The real profitability of every customer in every transport mode, with revenue at risk from large, low-margin accounts flagged early.
TURBOARD brings TMS, WMS, ERP, fleet and contract data into one governed model, so logistics companies see margin by customer, mode, route and cost line across road, rail, air, sea and warehouse operations.
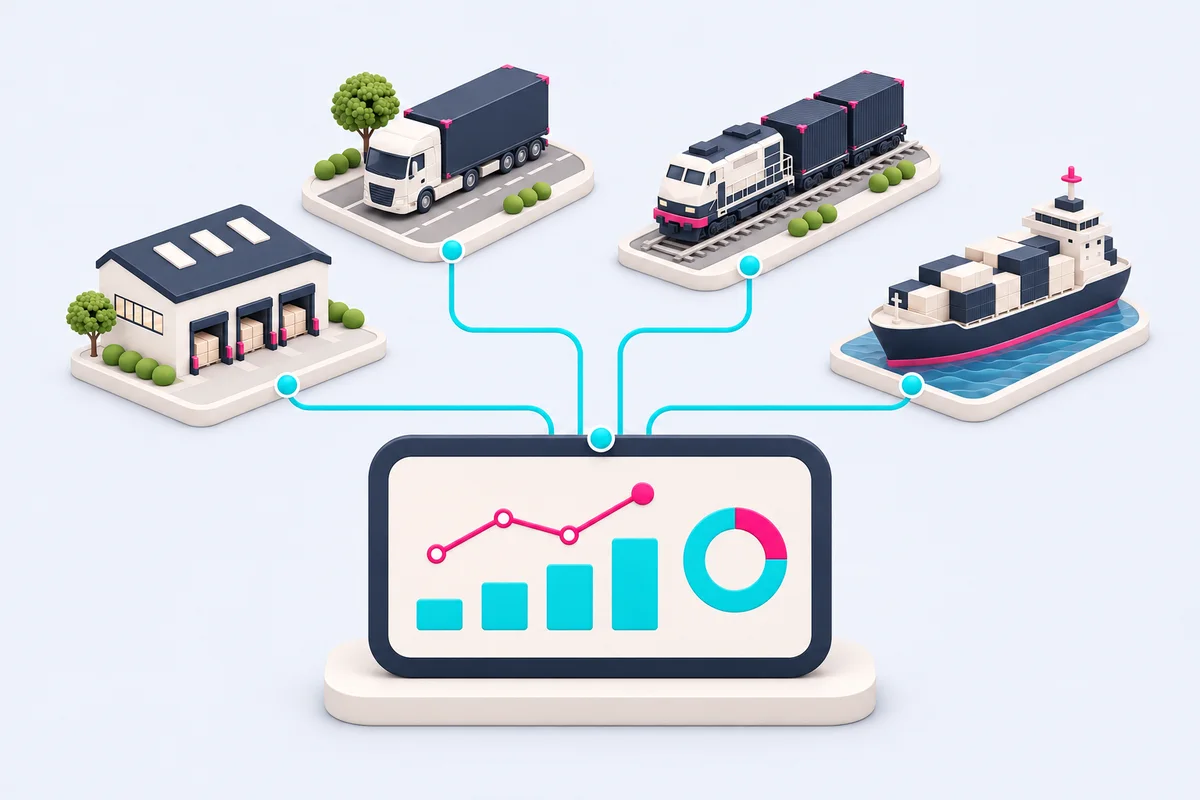
Running a logistics business means managing cost, capacity, transit time, customer profitability and modal efficiency at the same time. Yet TMS, WMS, ERP, finance, fleet telematics and customer contracts sit in separate systems. A high-volume customer can be eroding margin through waiting time, empty returns, fuel and tolls — and nobody sees it until the month-end close, if then.
TURBOARD joins operational and financial data in one analytical layer. Net margin is calculated by customer, mode, route and trip, cost lines are modelled separately for each mode, and empty-return and idle-capacity rates sit next to revenue. Management, operations, finance and sales look at the same metrics, each limited to the customers and regions they are responsible for.
Operations by mode, revenue by customer and margin by route, with idle capacity tracked alongside gross margin. Watch the analysis drill from road operations into one international route, where JAS explains the margin gap and breaks down trip cost to show empty returns as the main driver.
The real profitability of every customer in every transport mode, with revenue at risk from large, low-margin accounts flagged early.
Volume, revenue and margin by route and trip, showing which lanes carry high volume at low margin.
Empty-return, load-factor and warehouse-utilisation rates by mode, route and customer, set against a benchmark.
Fuel, tolls, driver cost, waiting time, handling and terminal fees compared by customer and mode, with conditional formatting on deviations.
Transit time, on-time delivery and returns analysed alongside volume and margin, not in a separate report.
Vehicle utilisation, stop times, maintenance and cost per kilometre by vehicle, driver and route, with fleet positions on GIS-S maps.
With TMS, WMS, ERP, finance, fleet and contracts in separate systems, management gets different answers to the same question.
All sources feed one governed model, so management, operations, finance and sales decide from the same metrics.
A customer with high revenue can produce little profit once waiting, empty returns and extra handling are counted.
Net profit, margin, revenue at risk and cost variances are shown together for every customer.
Moving the same load by road, rail, air or intermodal gives different cost and margin outcomes, yet the choice often rests on experience.
Modes are compared by customer, route, volume, transit time and margin, so pricing and routing proposals rest on data.
When margin falls, it is hard to tell whether fuel, empty returns, waiting, handling or terminal fees are to blame.
Each mode’s cost lines are modelled separately, and JAS explains the variance with a chart and a pivot.
JAS, the AI assistant built into TURBOARD, answers from the governed logistics model your reports use. Ask in plain language and she finds the data, builds the pivot or chart and explains which customer, mode or cost line drove the change. With personas, a CFO, a COO and a key account manager each get an interpretation written for their own decisions.
Explore JAS capabilities →We will connect a sample of your TMS and finance data and show how TURBOARD and JAS reveal margin by customer, mode and route.