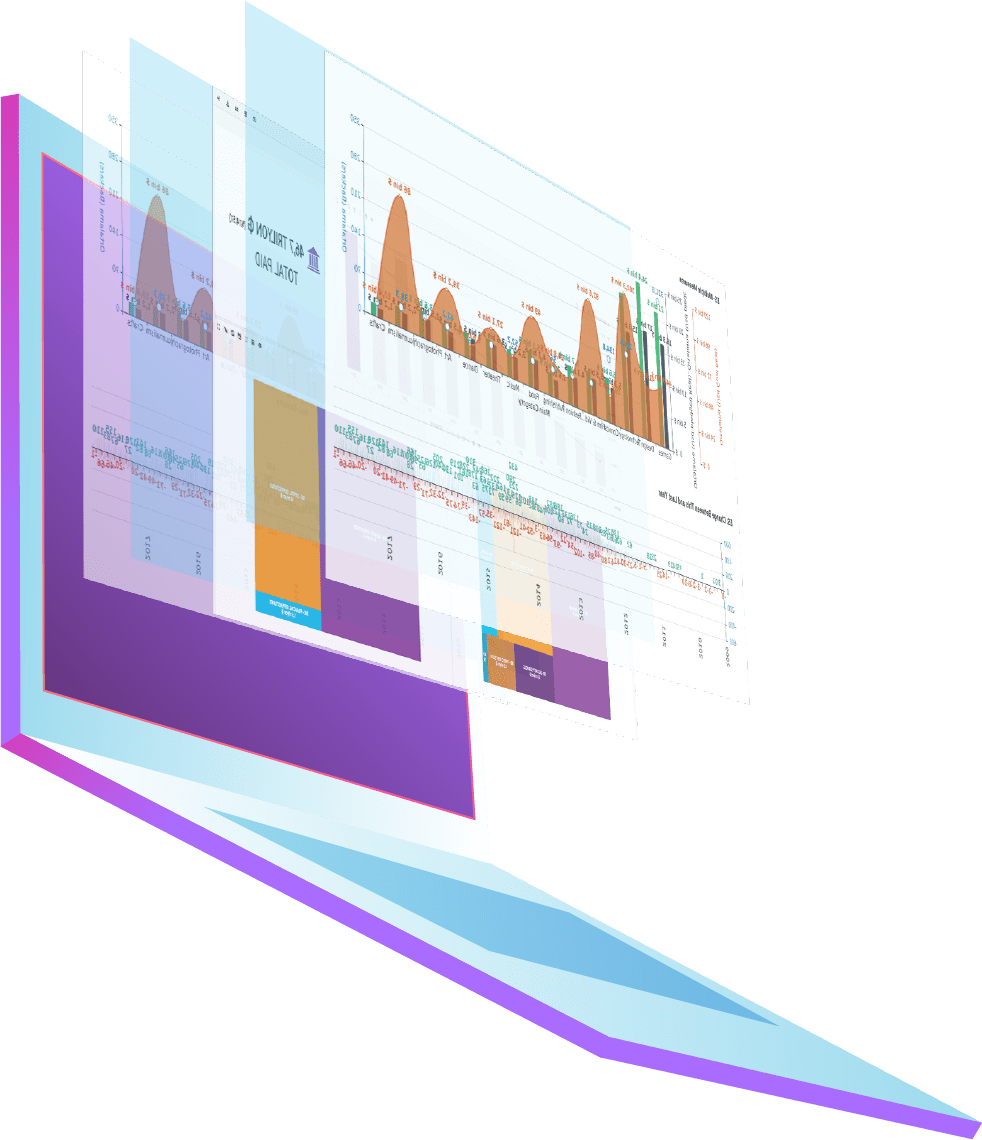
Banking and Finance Institutions need access to answers they need to measure profitability, asses growth and make financial decisions backed by data.
With TURBOARD, you can share important financial information with partners in real time, and manage all banking transactions with data based decisions.
What can TURBOARD do for Banking and Finance Sectors?
To support better decisions, collect and arrange financial data and send reports in real time
Create easy and quick analytical models to calculate risk and stability for an asset, customer or location
Analyze your past data to improve related product and service quality, minimize risks and enhance customer experience
Use location information to deduce market potential, optimize branch and ATM networks and improve cash management
Calculate risk and stability potentials of locations and assets to balance your risk-reward profile
Save on time and money by creating interesting and meaningful reports to support your financial decisions
Calculate volumes of customer card requests, credit usage and insurance transactions
Create promotions based on customer activity
Schools and academies are no strangers to data. Institutions need data to assess how they perform and in which areas they should improve. But when these data is spread across departments, buildings or campuses it can get very difficult to manage.
TURBOARD, with meaningful visuals and reports, allows school managements, teachers and parents to make data oriented decisions.
What can TURBOARD do for Schools?
Allows non-technical users like teachers and parents to make data based decisions
Create reports that provides information at a glance
Compare your performance with other schools with ease
Improve your services and courses; track your students successfully from registration to graduation
Seamlessly integrate reports and visuals to user interfaces and increase usability, as well as user interaction
See academic support expenses per student, research and development grants and donations amounts from graduates
See success ratios based on age, department and hobbies, and plan your education strategy
Energy institutions need business intelligence solutions to make more reliable supply and demand predictions, regulate supply chains, create sustainable distribution models and reduce costs. Energy suppliers also need reporting and real time tracking with business intelligence solutions for real time tracking, analysis and consolidation of data from suppliers.
With TURBOARD, we help energy suppliers become energy service providers and help them create value from their customers.
What can TURBOARD do for the Energy Sector?
Make more reliable supply and demand predictions
Optimize your supply operations and create sustainable distribution models
Access data based predictions in real time to see energy consumption, inspect the data and make sure you are complying with regulations
Measure customer turnover, identify your risks and find new potential customers
Quickly respond to market opportunities, enhance product offerings and improve customer satisfaction
Track the performance of your assets from infrastructure to equipment, to personnel and correctly predict your operations
Manufacturers are producing data in every step of their process, and they need analysis platforms to increase quality, check inventories, direct sales channels. TURBOARD helps you to blend data from multiple data sources and provides a united analysis platform. With TURBOARD, manufacturers can gain a wider perspective on their whole data and make strategic decisions.
What can TURBOARD do for the Manufacturing Sector?
Create quality control reports in a much more dynamic and innovative interface
Compare production and costs per period, and probe the difference between periods
See machines that stopped, figure out why they stopped and calculate your losses
Compare efficiency of shifts
Blend data from markets you might export to with your own data
Draw an optimum line with regression and inspect outlier workers, machines and products
Go deep down on causal factors to find details in order to increase operational efficiency
With a smart interface, easily make decisions on the whole data
Monitor production cycles in real time
To gain insights into the efficiency of production units and the production quality, use machine learning based analytics and create warnings for when anomalies happen. With this mindset, make lean production possible, reduce disruption times and regulate production cycles.
Determine what causes waste and use customer request and feedback data to reduce waste, optimize production and create better customer experiences
In order to identify demand trajectories earlier, develop sale strategies and increase growth opportunities using advanced analysis techniques and gain intelligence.
Government institutions need an information and data based management view in order to act quickly and sustain operational efficiency. Data analysis and business intelligence are top priorities for government and local administrations. Administrations are steering institutions and departments to make more data oriented decisions, share data and cooperate more actively within government. Our government customers prefer TURBOARD in order to gain actionable insights from multiple sources and benefit the public.
What can TURBOARD do for the Government and Affiliated Institutions?
Use your data to better serve citizens
Use your budget well, compare projects
Work to achieve positive social change, low crime rates, and increased citizen prosperity
Collaborate with meaningful dashboards from your data to solve problems and publish interactive visuals to quicken change
Analyze your projects as deep as you like based on expenditure, completion time and operation levels
Non-profit organizations need to be transparent in their spending reports to be able to increase donations and members. Organisations, Relief Agencies, Foundations, Government Associations and Institutes need members, events or volunteers to survive and reach to more people.
Communication, transparency and trust is paramount for a non-profit. Thus, managing assets well depends on managing the data well.
What can TURBOARD do for Non-Profits?
Make it possible for your members and donors to interactively see where their donations go
Track your volunteer profiles, their education, preferred programs or aid types and available working hours with TURBOARD
Managers can use this information to plan and organize the roles of volunteers efficiently
Report annual member counts and types, as well as donation variety or types
Monitoring loyal customers, making department and basket analysis, analyzing customer satisfaction, controlling diminished goods and warehouse inventory, tracking inter-branch income and expense balance is essential for grocery store chains to increase their market share.
With TURBOARD, you can create meaningful reports from all your data, track your cash registers in real time and analyze your growth targets with respect to your past data.
What can TURBOARD do for the Grocery Store Chains?
Monitor your general sale trends and compare them with previous periods with ease
See supplier inventory from your own data
Create data based offers and compare result of offers per period
Solve general food retail 5% out of stock problems with trend based monitoring
Examine competitor prices by blending them with your data
Using data science methods predict sale amounts if the price were to change
Calculate profitability based on price changes and determine optimum prices
Create special offers with basket analysis
Are you still checking your hotel or tourism income and expenses with complex reports generated from accounting programs as was done 50 years age?
With TURBOARD, you can track visitor spendings, your daily, monthly and yearly service expenses, rate of turnover of your marketing budget, customer satisfaction and loyal customer analysis in a single platform, as well as increase service quality and create balance of income and expenses.
Exporting your data from other programs or even external services (Google Ads, Analytics etc.) to create reports is very important to increase your visitor numbers.
What can TURBOARD do for the Tourism Sector?
Analyze how many rooms were full yesterday and how did visitors spend their money
See the difference between last week, last month and last year with respect to the current one, and even see the differences in full room counts and spendings between two holidays
Decide how much online marketing budget you should allocate to which city, age or marital group based on the resident city of visitors, their age and marital status
Examine agency performance, create scorecards and determine objectives
Review visitor activities and take preventive measures to increase revenue
Monitor trends in vacant rooms, determine your prices based on trends
Inspect the popularity of services like spas and optimize their revenue
Predict room demands based on previous check-ins, market trends, special events and more to increase revenue
Retail is the backbone in an ever globalizing economy. For decades, retail has been the center of attention for the global economy.
Retailers should be able to diversify into new markets, keep their inventory
costs in check in a market with ever changing consumer demands, unstable and floating markets, lower profit margins, market saturation and price wars; all the while being able report, monitor and predict these factors in real time. Retailers can use TURBOARD to analyze consumer behaviours, business models, operations, consumer experience; and gain an edge in an overcrowded retailers market to rise above others.
What can TURBOARD do for the Retail Sector?
Analyze your retail strategy; clone first, then easily compare
Create alarms for when your store’s targets haven’t been met or underperformed
Design your stores based on consumer preferences and analyze the results
Create your sales and promotions based on data
Analyze customer feedback surveys and sale data
Examine user behaviours on your e-commerce website
Track and visualize visitor behaviours with basket analysis; see sale conversion ratios, average basket sizes, basket abandonment, coupon usage and many other factor
Watch daily sale activity based on product and store
Check current inventory, sale and remaining product numbers
Predict special days, seasonal fluctuations, consumer demographics from data and chart your future trajectory
Today’s Oil and Gas companies should be able to make swift decisions based on data to keep up with changing market conditions and fierce competition.
What can TURBOARD do for the Oil and Gas Sector?
To keep ahead of supply and demand, create visuals for daily, weekly and seasonal usage changes
To keep up the supply with demand and increase operational efficiency, predict supply and demand with our analytics tools with an aim to reduce overhead
From tracking equipment to market trend analysis, monitor changes in real time
With instant reports, reduce recurring expenses as well as satisfy your reporting needs
Create financial reports for income, expense, equity/debt ratios
Track changes based on month, quarter or year; get instant emails for anomalies
Track your hydrocarbon releases for official reports or to prevent possible fines
From achieving better outcomes for patients to creating transformative medicines, data is the focus of every health and life science organization. But since sensitive health data is spread across different sources, this creates security and data management issues. To overcome these data issues and to make their institutions truly data oriented Turkish Ministry of Health is trusting TURBOARD.
What can TURBOARD do for the Health Sector?
See the status of your hospital based on hundreds of quality indicators
Examine the activity of full time, part time or contracted doctors
Monitor the usage stats of devices, calculate profitability and decide if you need to order new devices or not
Create scorecards for doctors
Increase care quality with 360 degree patient and customer view
To improve services, streamline processes and utilize new revenue streams, create new customer oriented applications and analysis capabilities directly from TURBOARD
Improve patient outcomes with advanced medical analysis, support medical decisions and reduce medical waste
Gain insights to identify high risk patients, plan patient specific treatments and optimize hospital accommodations
Analyze emergency room wait times and optimize average wait times
Control your hospital inventory with alerts and check current inventories
Avoid recurring records
Create local disease maps
Minimize unnecessary prescriptions
Reduce patient complaints
In order to make faster decisions in health and life science organizations, learn how TURBOARD allows you to analyze and store your data safely and affordably.
Every dispatch with their weight, size, the amount of space it occupies in transport, contact information and returns create immense data every day.
TURBOARD, our native business intelligence solution, can provide extensive reporting to manage logistics analysis in an orderly manner, reduce shipping mix ups, and improves shipping experience (duration, successful delivery, returns etc.) in general. With TURBOARD, controlling and understanding all your logistics will make a great difference in your daily work activities and allow you to take full control of your establishment.
What can TURBOARD do for the Logistics Sector?
Analyze transport volume, use it efficiently and allocate it accordingly to projects
Visualize fleet GPS data to order routes, plan maintenance and reduce stop times
Determine costs and make detailed benefit analysis to increase revenue
Optimize your timely delivery to increase customer satisfaction
Predict bottlenecks and peaks with predictive analytics
Determine and highlight problematic areas
Manage and direct fleets
See and plan your storage capacity
Assess revenue per miles and vehicle operation costs per mile per day, driver or route
Determine demand based on day, weather, area or demographic and allocate resources
Telecommunication industry is quickly changing. As wireless devices become the norm, demand for bandwidth increases and consumers are looking for better service. The industry is looking for ways to increase revenue while meeting consumer demands.
What can TURBOARD do for the Telecommunication Sector?
Report age, usage status, package details, hardware upgrades and user complaints for cell towers
Use TURBOARD analytics to predict network coverage and reduce complaint calls to prevent losses
Provide additional visuals to businesses you provide wifi services to. Report bandwidth and traffic
Manage Call Center employees, report call durations and increase efficiency