Enrolment and recruitment
Screened, randomised and active subjects against plan by study, country and site, with screen-failure and dropout rates and their reasons.
TURBOARD brings EDC, CTMS, laboratory and safety data into one governed model, so CROs, sponsors and research sites follow enrolment, safety and data quality across the whole portfolio.
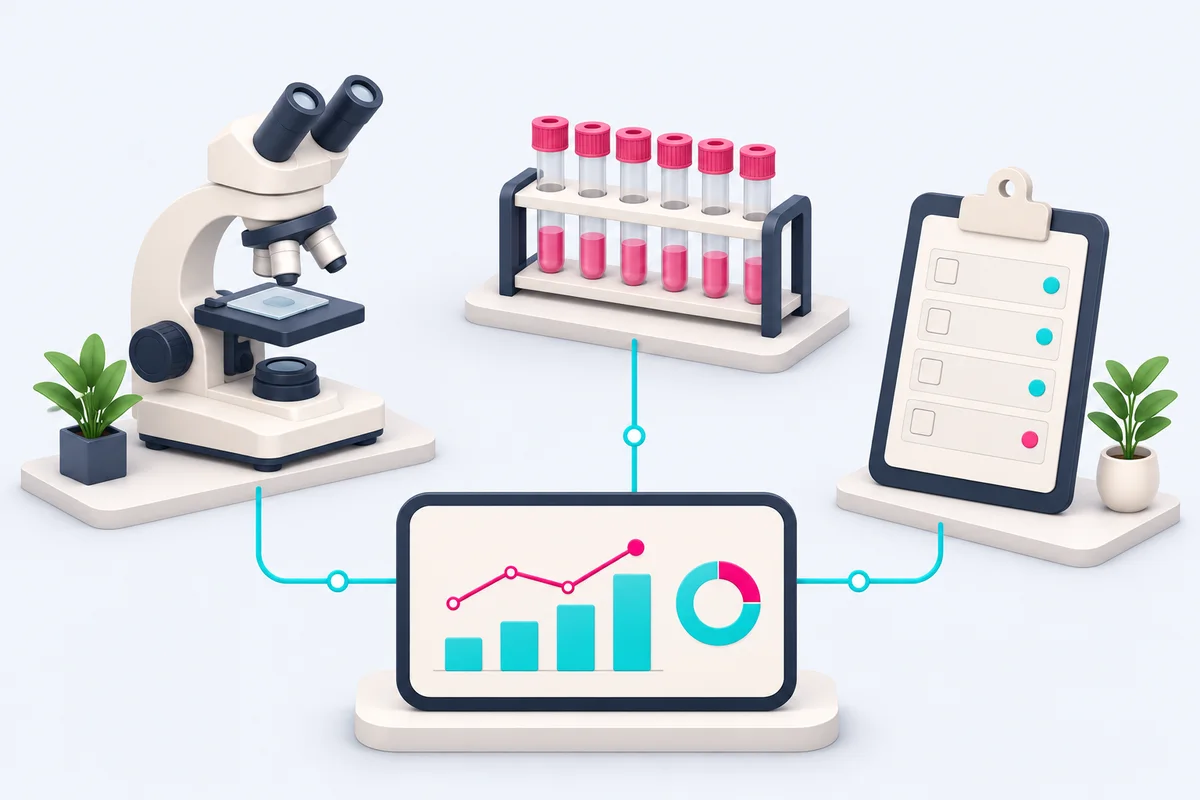
A running trial produces data in the EDC, the CTMS, central laboratory files, safety databases and site spreadsheets. Medical monitors, sponsors, steering committees and investors each need their own report, so study teams spend days every cycle exporting, cleaning and reformatting the same data. By the time a slow site or a rising screen-failure rate is visible, weeks of enrolment have been lost.
TURBOARD connects these sources once and calculates enrolment, visit compliance, adverse events and data quality the same way for every study. Each stakeholder sees a dashboard limited to the studies and sites they are entitled to, and recurring reports are distributed automatically. Study teams review the data instead of assembling it.
Screened, randomised and active subjects against plan by study, country and site, with screen-failure and dropout rates and their reasons.
Enrolment speed, visit compliance and open data queries per site, compared side by side so under-performing sites are visible early.
Adverse events by severity, seriousness, status, study arm and dose, with drill-down from the portfolio to the individual subject.
Visit counts and dates across trial periods, lab values by arm and gender, and outlier analysis on rating-scale outcomes.
All studies on one screen — status, milestones, enrolment and safety — to support go, adjust or stop decisions.
Public trial registry data analysed by therapeutic area, phase, sponsor and outcome, for protocol planning and competitive context.
Reports for monitors, sponsors and committees are rebuilt in spreadsheets every cycle.
Dashboards refresh with the data and scheduled reports go to each stakeholder as PDF, Excel or PowerPoint.
EDC, CTMS, lab and safety systems each hold part of the picture, and nobody sees the whole study.
Sources are joined over shared dimensions such as study, site and subject, so every metric is calculated the same way.
Sponsors, CRO teams and sites must see only their own studies and subjects, which multiplies report versions.
One dashboard serves everyone; every user and every scheduled report sees only authorised data.
Slow recruitment, missing visits or rising adverse events appear only in the next periodic report.
Conditional formatting marks sites and metrics that cross their limits as soon as the data refreshes.
JAS, the AI assistant built into TURBOARD, answers from the same governed study model your dashboards use. She finds the relevant report or writes the query, builds the chart and explains what changed. With JAS Explain and personas, a medical monitor and a sponsor executive each get an interpretation that fits their role, from identical numbers.
Explore JAS capabilities →We will connect a sample of your study data and show how TURBOARD and JAS track enrolment, sites and safety across trials.