What's New
September Release Highlights
In August, our team tackled 312 issues, bringing a mix of new features, performance enhancements, and improvements to key functionalities. Here’s a look at the three standout updates for September.
Custom GenAI Personas for Dashboards
With this latest update, designers can now select a custom default “JAS Explain” persona for each dashboard, overriding the global default. This enables them to tailor the analysis and explanations based on the specific context of the dashboard.
For end users, this means the analysis can be personalized depending on who will be monitoring or using that dashboard — whether it's an HR Manager, a Strategic Executive, or a Financial Controller. However, even with a default persona set, users still have the flexibility to change the persona to gain insights from a different perspective. This is especially useful when the same dashboard is used by different departments or business units.
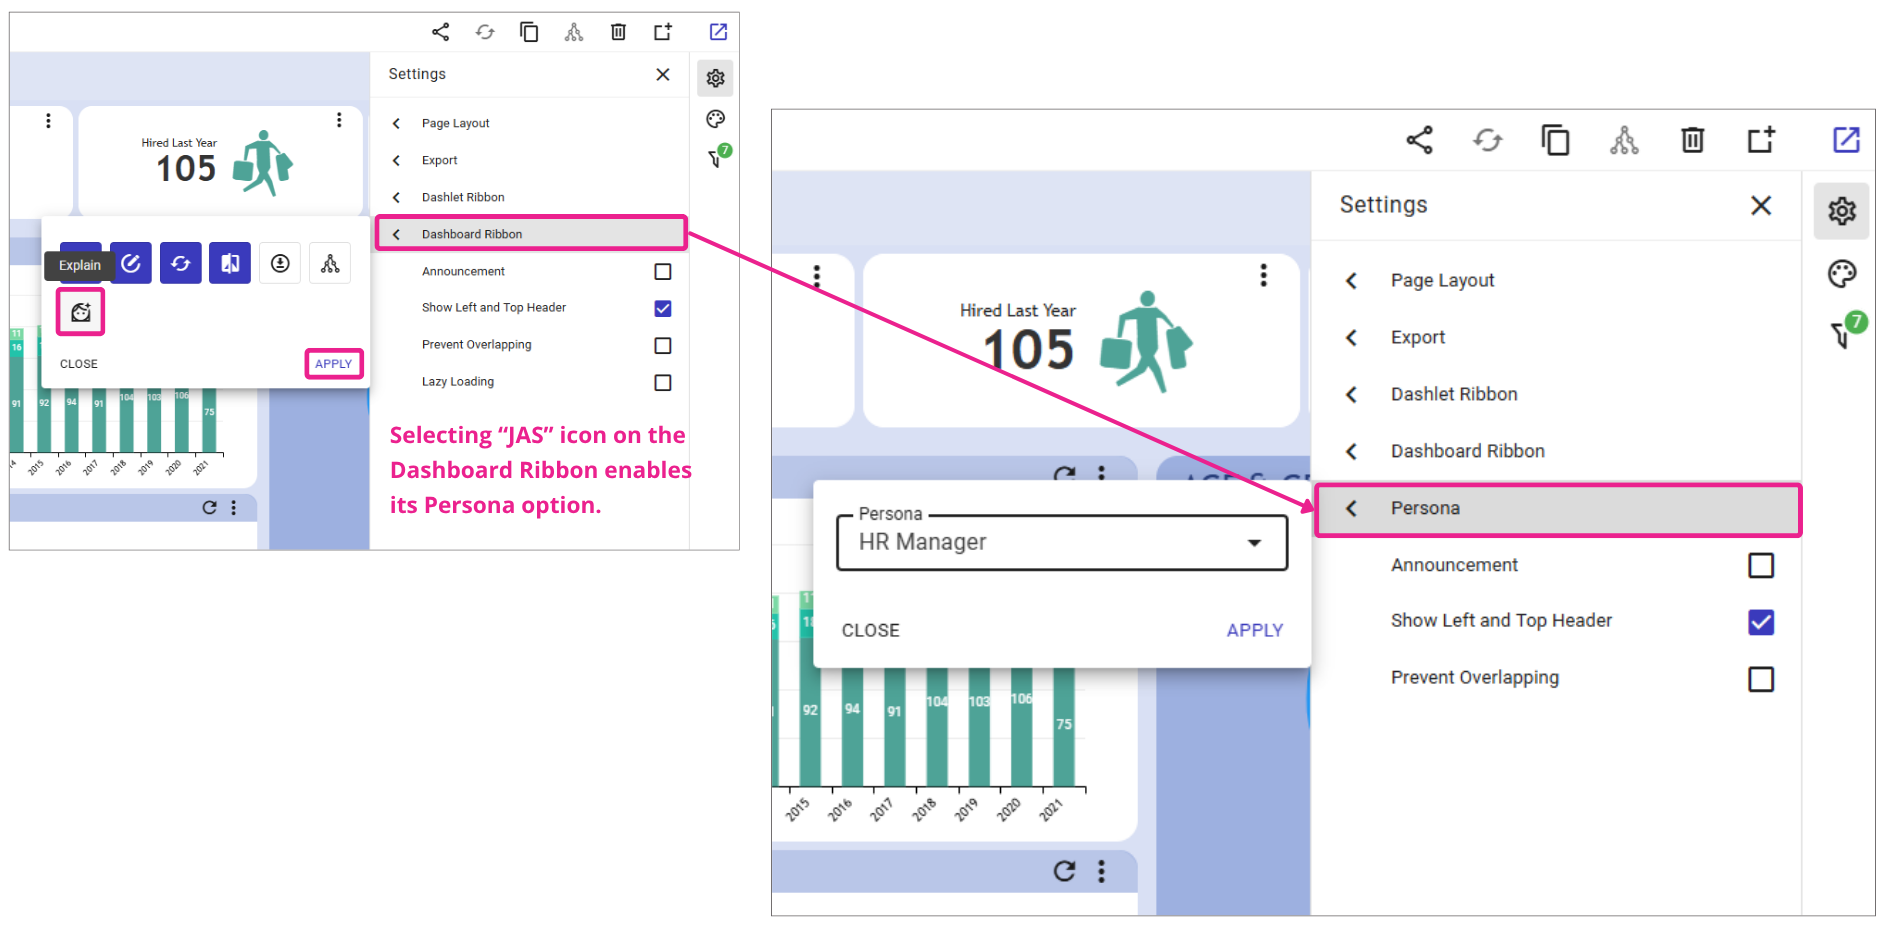
Designers can enable this feature from: Dashboard >> Edit >> Settings Panel.
To see this feature in action, watch the demonstration video showcasing how JAS analyzes two different dashboards.
JAS analyzes the Workforce Overview dashboard from an HR Manager perspective and the Earnings & Targets dashboard from a Financial Controller perspective.
Freezing Columns in PTs
We’ve added the ability to freeze the first 1, 2, or 3 columns in default datacell pivot tables (those without measures). As you scroll horizontally across the table, the frozen columns stay anchored on the left, so you never lose track of which row you're viewing.
This feature is especially useful in dashboards with rich, multi‑column layouts as it improves readability, prevents misalignment of data with row labels, and makes it easier to navigate wide pivot tables.
Check how it looks on this dashboard.

Server-Side Data Aggregation for GIS
GIS maps now handle extensive geospatial data through server-side aggregation. When dealing with large datasets of hundreds of thousands of points, the system displays aggregated clusters, represented by circles with numbers indicating the count of data points within each cluster, instead of rendering individual data points on the map.
As users zoom in, these clusters break down into smaller groups, providing detailed insights without compromising performance.
This approach ensures that users can interact with large geospatial datasets seamlessly, offering a smooth, responsive experience.
To see this feature in action, watch the demonstration video showcasing the “4M Pokémon Distribution” dashboard and its enhanced GIS capabilities. You can try it yourself in this dashboard.

Stop building dashboards, and start getting answers. Experience the next era of BI with our leading GenAI capabilities ‒ request your personalized free demo today.