What's New
August Release Highlights
In July, our team addressed 246 issues to improve stability and performance. This month, we're excited to introduce a new suite of features focused on giving you greater visual depth and more dynamic styling control over your charts and dashlets.
Introducing 3D Column Charts
We're excited to introduce 3D Column Charts, perfect for visualizing data with two dimensions and one measure. With added depth and perspective, these charts now feature a “Bar Colors” option, allowing you to color columns based on a selected dimension for better differentiation.
Explore a sample dashboard with 3D Column charts.
Apply Rich Color Scales to Your Charts
Enhance your charts with Color Scales! Apply a gradient of up to three colors across your chart's values for instant visual analysis.
This feature works across multiple chart types like Column, Bar, Pie, and Donut, with interactive legends that let you highlight and filter your data.
Custom formatting overrides the color scale for personalized visual control.
Explore a sample dashboard with color-scaled dashlets.
Customizable Opacity for Clearer Visuals
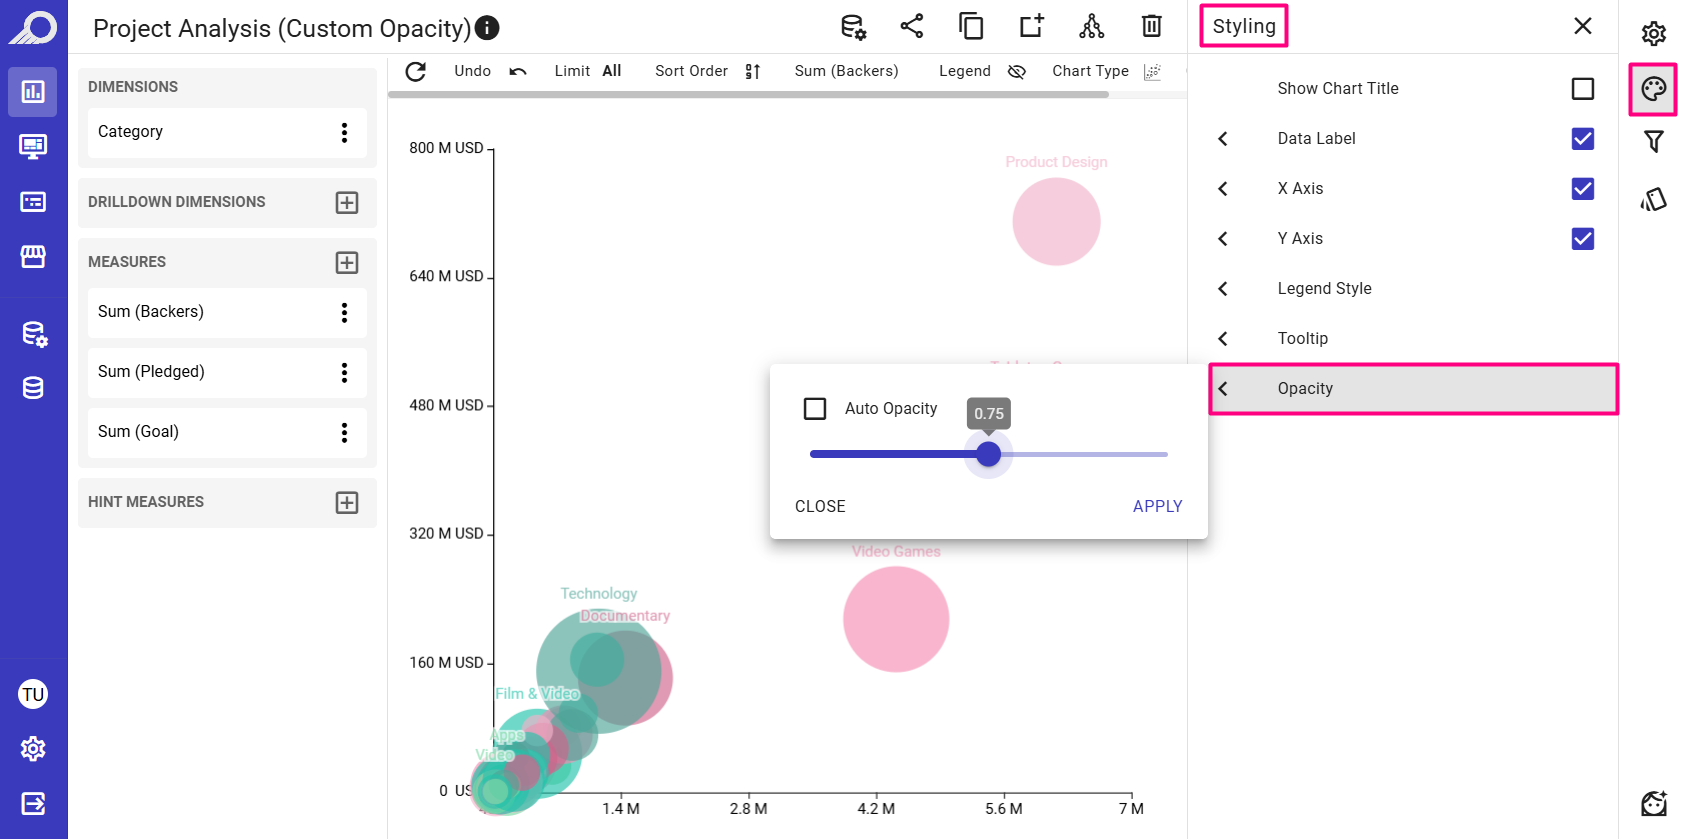
We've enhanced the Opacity feature to give you more control. Previously, “Auto Opacity” was set by default for Bubble, Scatter, and 3D Scatter charts. Now, this feature is fully customizable, and it’s also available for the new 3D Column chart.
The auto mode still dynamically adjusts opacity, ensuring background data remains visible, but you can now manually adjust the opacity to your preference for a cleaner, more precise look in dense visualizations.
Explore this sample dashboard to see these settings in action.

Stop building dashboards, and start getting answers. Experience the next era of BI with our leading GenAI capabilities ‒ request your personalized free demo today.