What's New
May Release Highlights
This month is all about filters: a completely rebuilt date filter that opens straight to the calendar, filter value synonyms so people can search with the words they already use, and measure limits your dashboard viewers can adjust for themselves. Alongside these, our team has successfully resolved 183 issues to keep the overall platform running smoothly.
The Date Filter, Rebuilt
Picking a date range should be the easy part. We reworked the whole flow so there is nothing hidden and nowhere to get stuck. The result is fewer clicks to set a range, recurring options that are easy to find, and a clear way out of every sub-selection.
See the redesigned date filter in action — watch the short video below to see how much faster it is to set the exact range you need.
1. Opens Straight to the Calendar
The selected range is now visible the moment you open the filter — no more clicking in just to see the dates you already chose. The calendar is right there, ready to adjust.
2. Recurring Gets Its Own Tab
Recurring options used to sit at the bottom and were easy to miss. They are now a dedicated top-level tab, so recurring setups — specific weekdays, months, and the like — are right where you would look for them.
3. There Is Always a Way Back
Opening a sub-selection such as the year used to trap you until you committed to a choice. A clear button now takes you back to date selection at any point.
Search by the Word You Know
You can now map search terms to the values stored behind them, so people can search with the words they actually use — even when those words do not match the stored names. Type the term your team knows, and the filter finds the right entity.
Type signal and the filter returns Acme. Type signal, colgate and you get both Acme and Aperture, without anyone needing to remember the exact stored names.
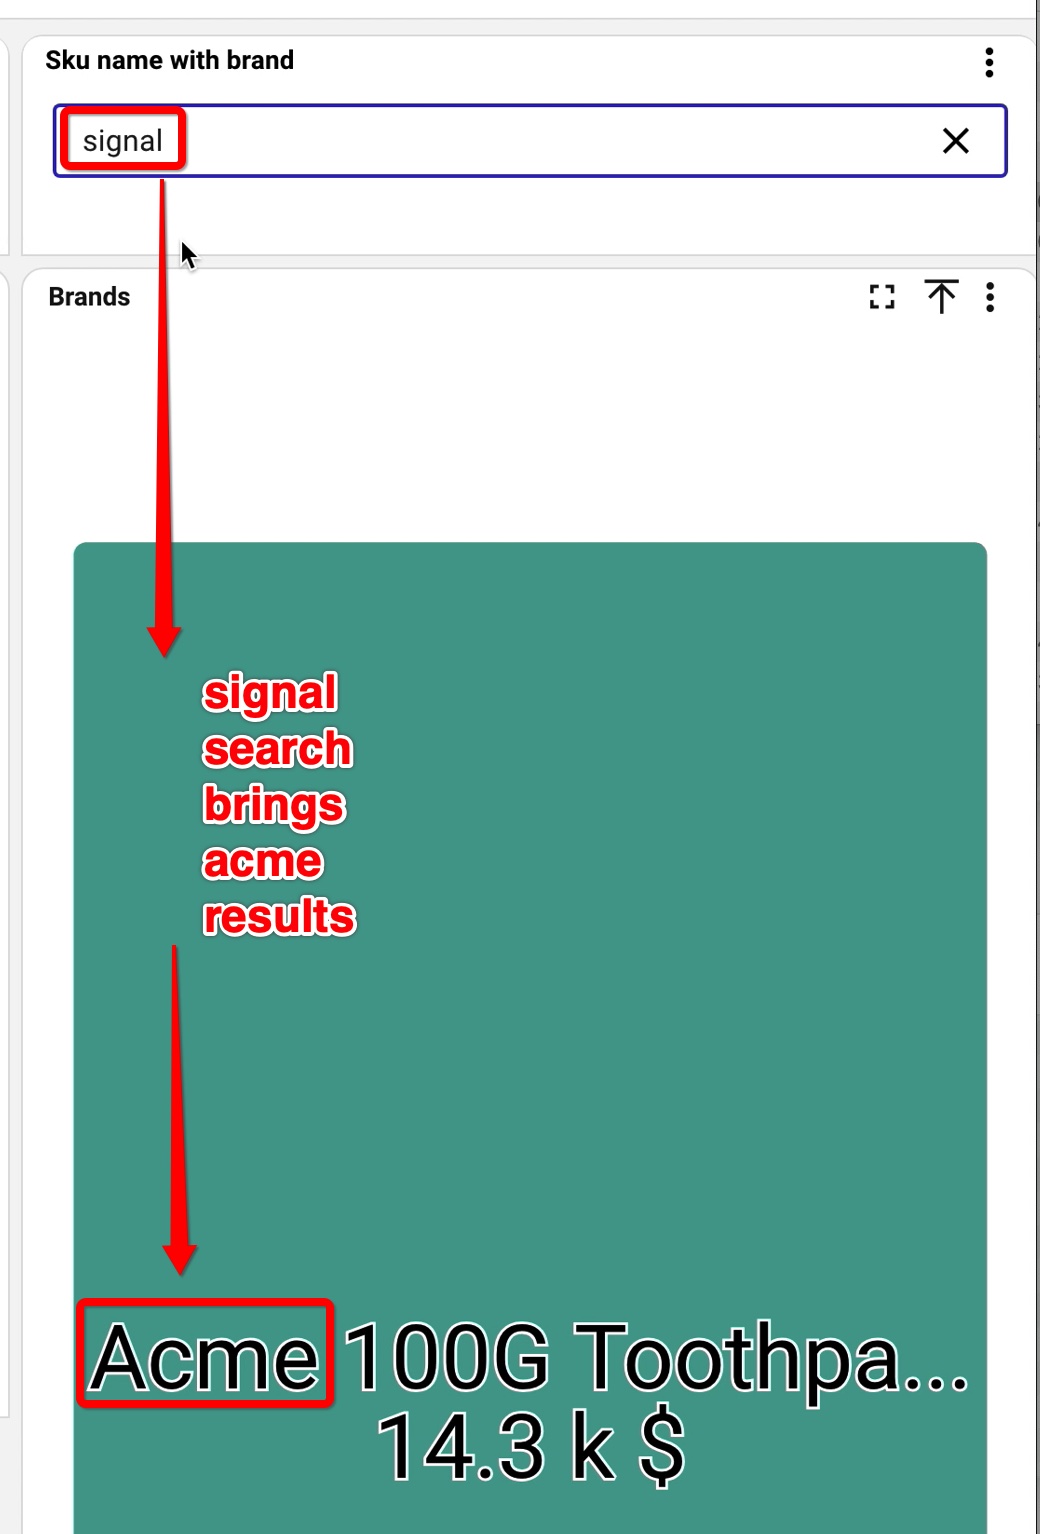
Searching “signal” surfaces Acme results, right on the dashboard.
Mappings can be one-way — “signal” sends users to “Acme” — or two-way, working in both directions so a search for either term surfaces the other. Synonyms live in the field section of a table on your data source: add a row per mapping, and the whole team searches the way they think.
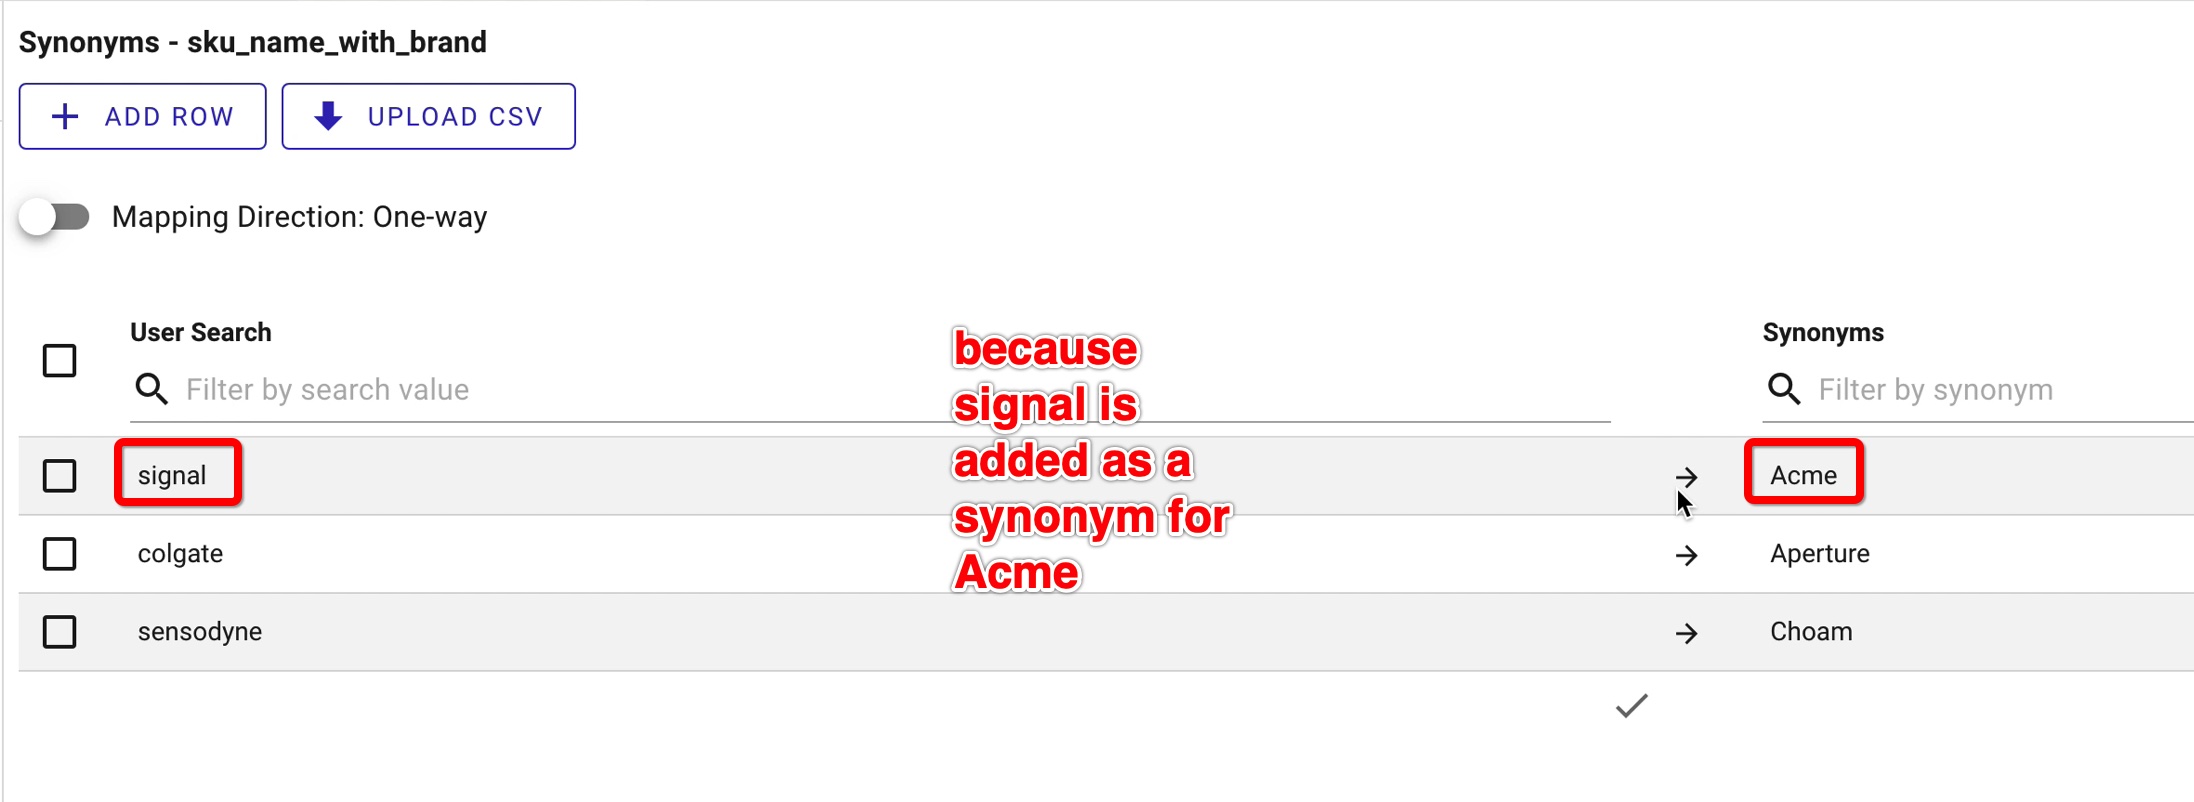
Map each search term to its value on the data source — with the one-way / two-way direction toggle.
Hand Measure Limits to Your Viewers
Minimum and maximum thresholds on a measure used to be locked to the dashlet edit screen (the playground) — set once by the designer, fixed for everyone after that.
With this release, the playground gains a new switch: “Allow this limit to be adjusted in the dashboard”. Enable it alongside your min and max thresholds, and you decide which limits viewers are free to fine-tune.
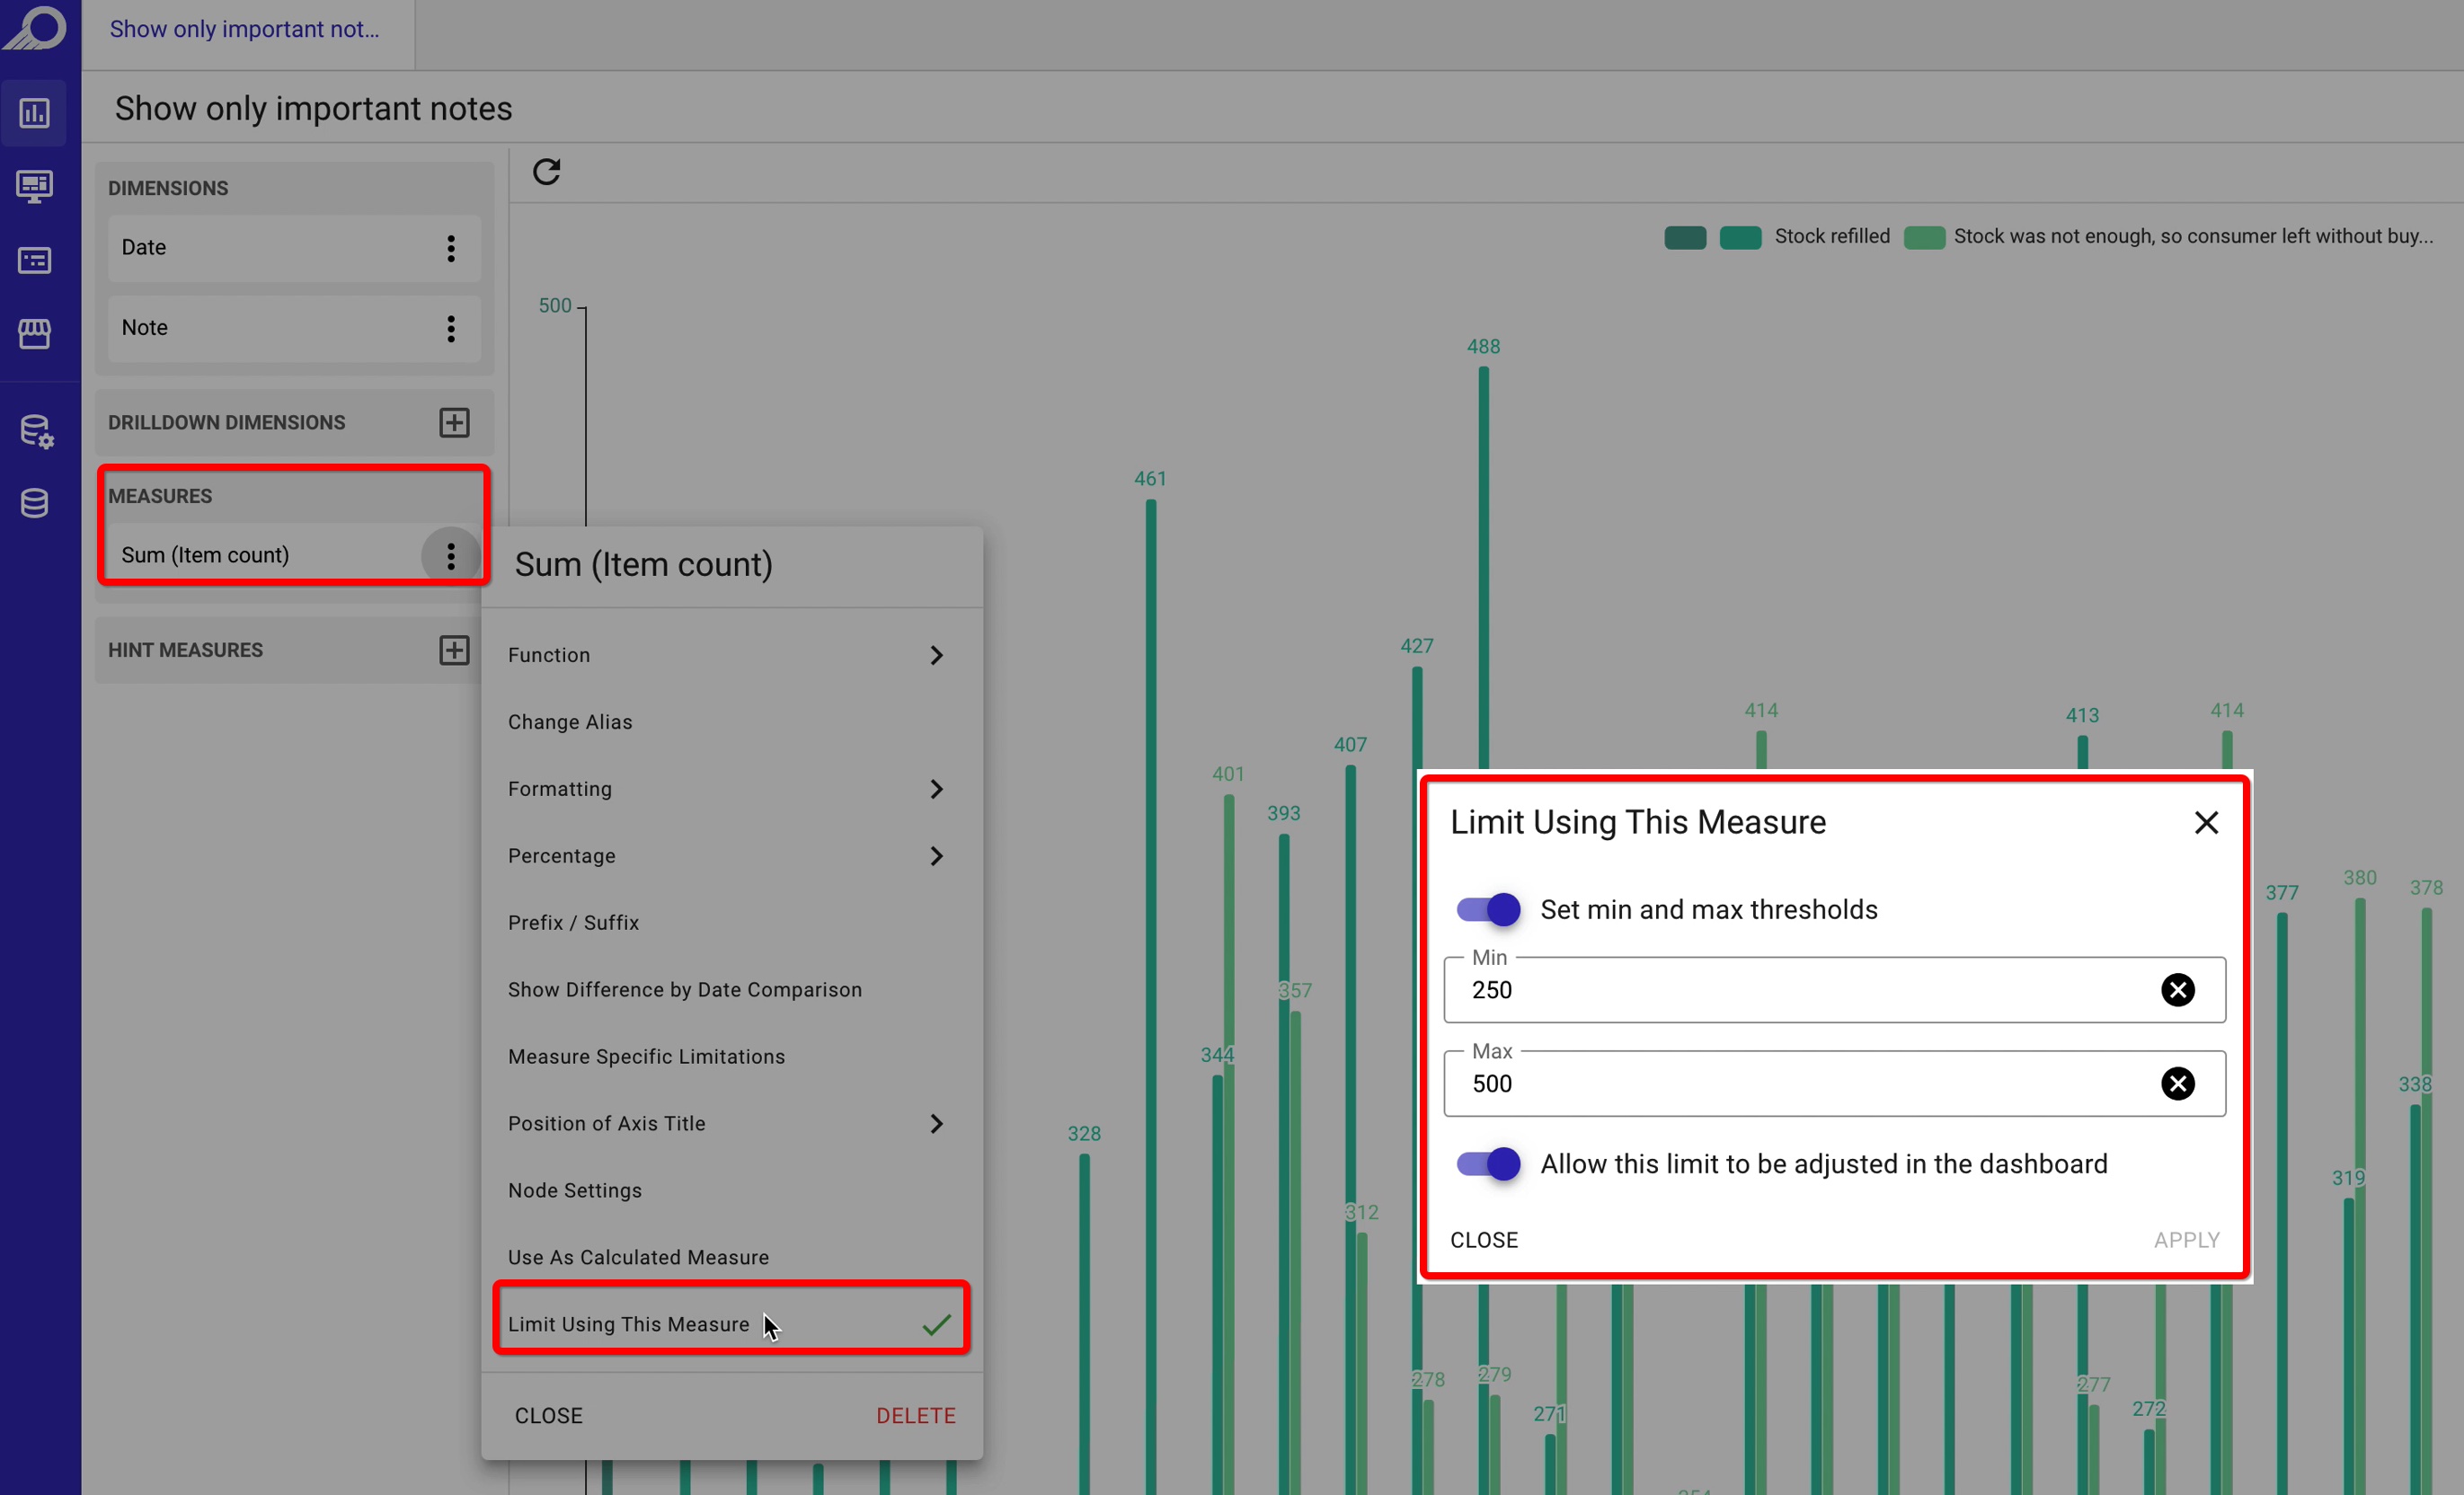
In the playground: “Limit Using This Measure”, now with “Allow this limit to be adjusted in the dashboard”.
Once it is on, anyone viewing the dashboard can open Limit Measures, set their own minimum and maximum, and apply — no edit access required. It is perfect for letting people zero in on the range that matters to them without touching the underlying setup.
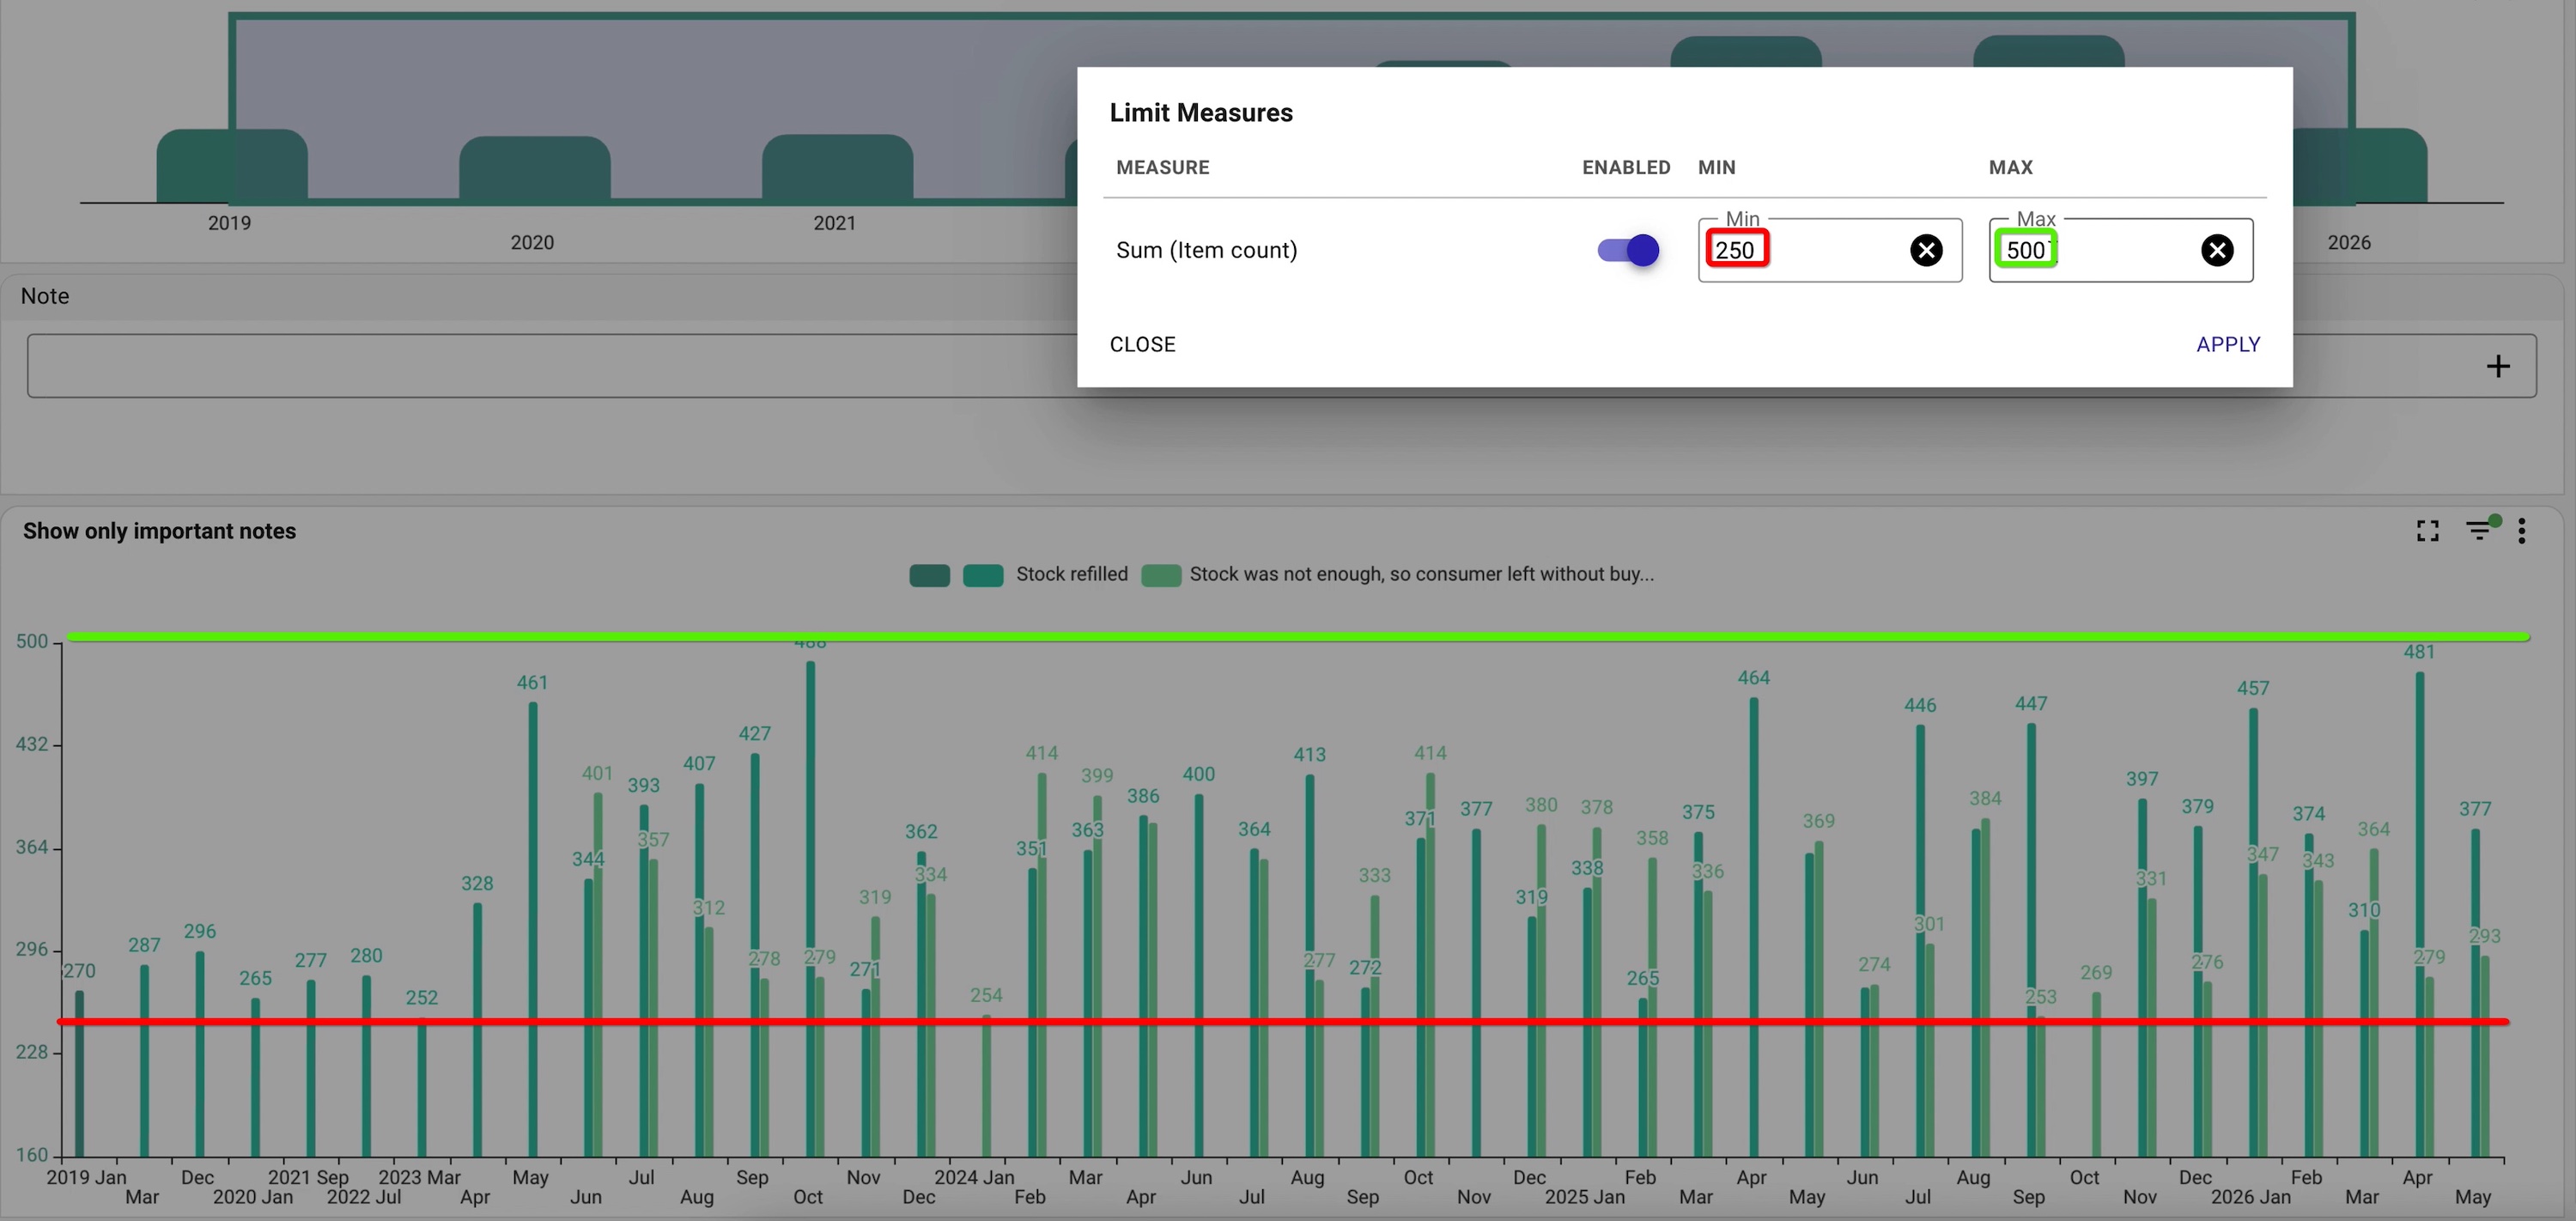
On the dashboard, viewers open Limit Measures and dial in their own minimum and maximum.
One More Thing: Z→A Sorting
Oh, and filters can now sort Z→A — right alongside the custom order you set by hand and the default A→Z. A small one, but a welcome one. You are welcome.
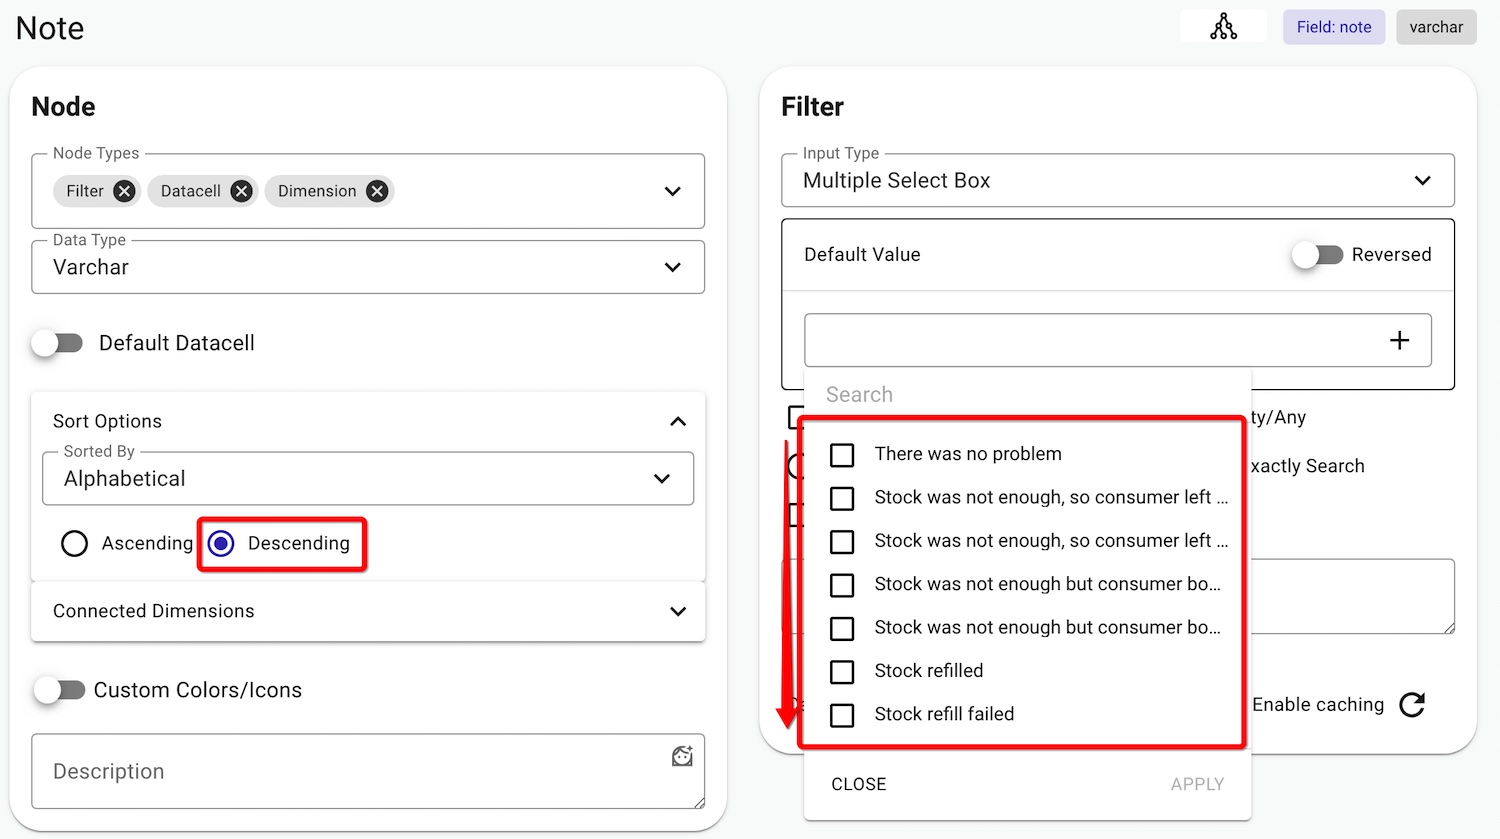
Pick Descending under Sort Options to flip a filter to Z→A.

Stop building dashboards, and start getting answers. Experience the next era of BI with our leading GenAI capabilities ‒ request your personalized free demo today.