What's New
October Release Highlights
This October release is the result of our team's dedicated work throughout September. We successfully resolved 155 issues, delivering a powerful mix of enhancements, alongside significant performance improvements for data management.
Advanced Optimization & Full Control for SQL Views
We’re shipping critical enhancements aimed at your custom SQL Views, fundamentally changing their performance and manageability. You can now dramatically speed up your data refreshes and gain complete transparency and control over the entire process.
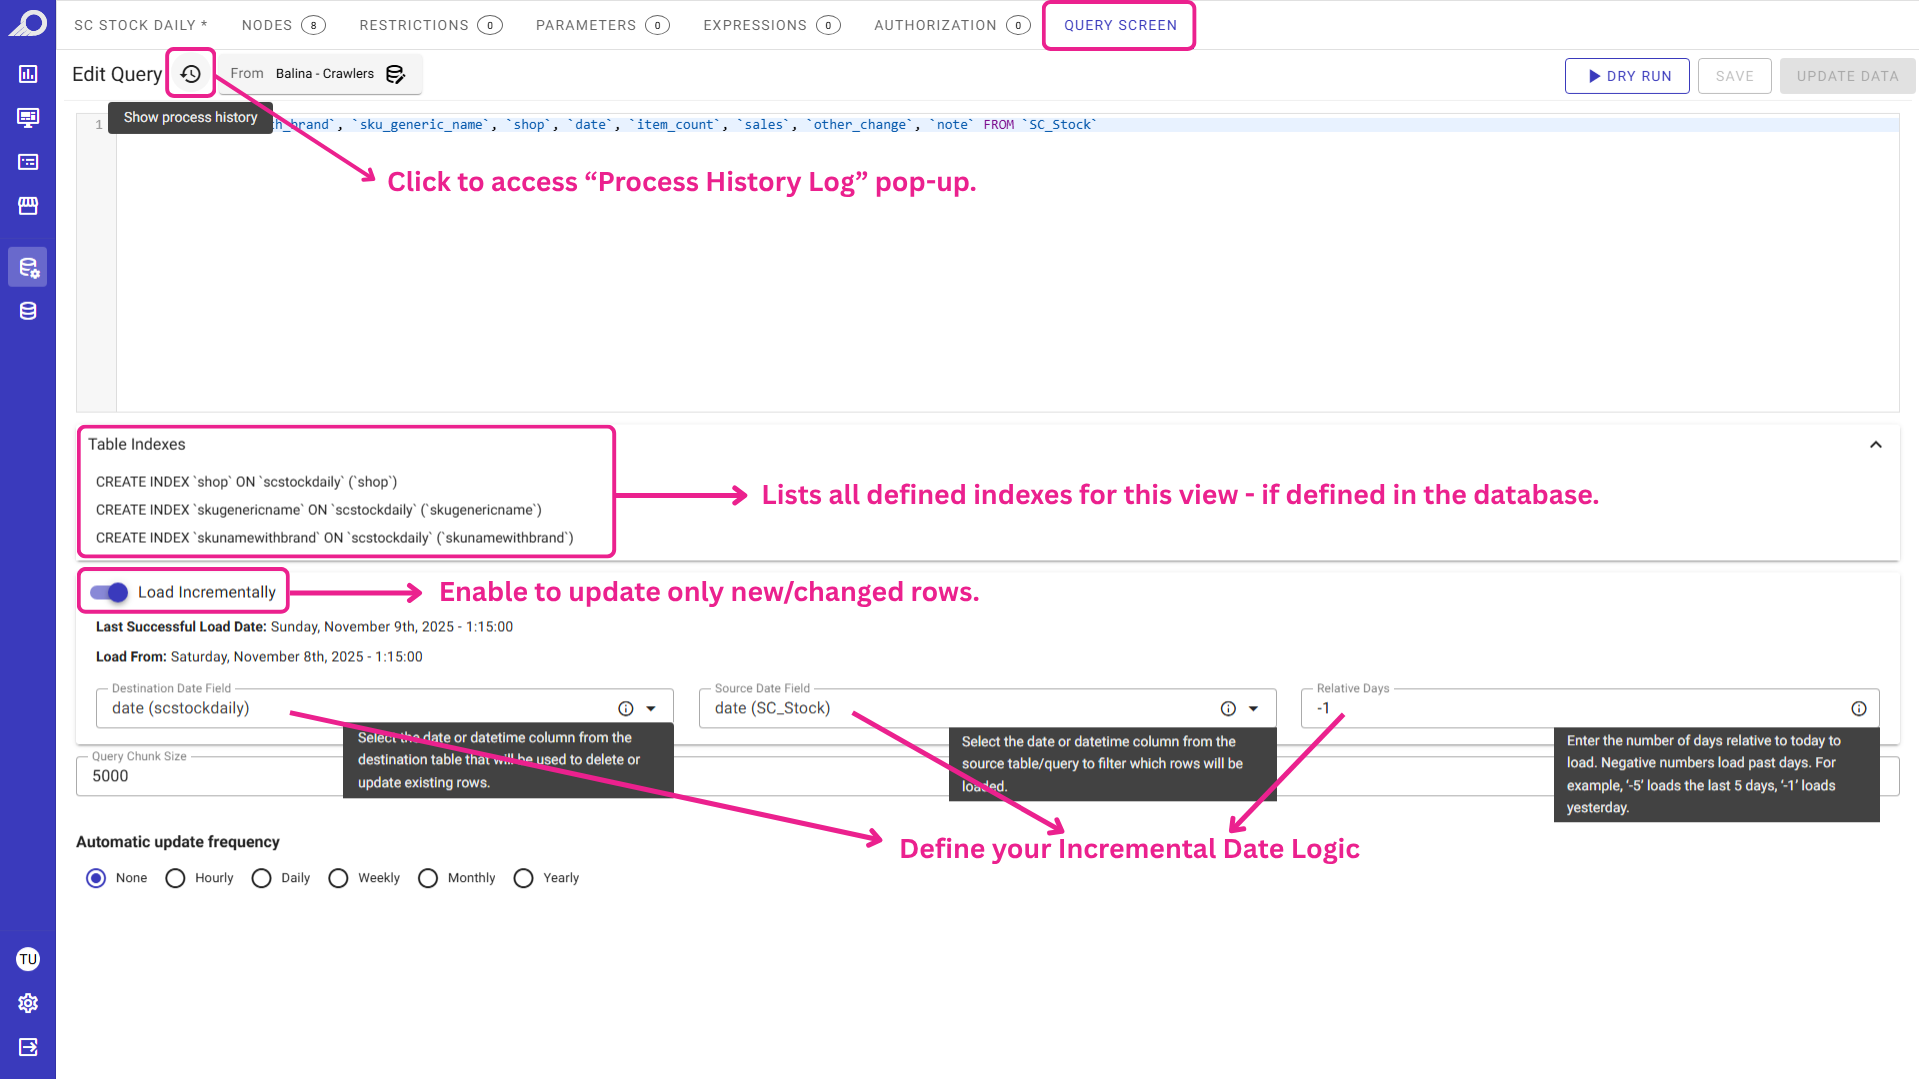
The enhanced “Query Screen”, showing new controls for Incremental Load, Table Indexes, and Process History.
Data Refreshes with Incremental Load
Stop reloading your entire multi-million-row dataset every time. We are thrilled to introduce Incremental Loading for your custom SQL-based Views.
Simply enable the “Load Incrementally” option and tell TURBOARD which date columns to monitor. The system will intelligently fetch only the new or changed rows since the last refresh.
- Faster refresh times by updating only changed rows.
- Reduced strain on your database.
- Up-to-date data without reloading everything.
Index & History Visibility
You can now see a clear list of all Table Indexes defined on your SQL View.
We've also implemented new logic to ensure these critical, performance-boosting indexes are protected during data refreshes.
Additionally, the new “Process History” log gives you a full audit trail of your data loads.
You can see exactly when a refresh ran, how long it took, and how many rows were added, giving you complete visibility and control.

“Process History” log shows refresh status, run times, durations, and row counts.
Regional Map Legends with Custom Condition Titles
Don't let rigid, auto-generated rule labels clutter your regional maps. A legend that automatically reads “Sales > 50,000” is functional, but may not be as clean or professional as needed. What you really want to show is “High Performing Region”.
This update gives you full control over your map conditional legends. When you add or edit a rule in the “Conditional Formatting” panel for your regional map, you will find a new “Title” tab.
Simply uncheck the “Use Default Title” option and write in your own clear, simple label. This custom title will appear directly on your map's legend, making your visualizations cleaner, more professional, and far easier for your audience to understand at a glance.

From Regional Maps Edit Mode >> Conditional Formatting Panel >> Add/Edit New Condition >> Title Tab
Smarter Regional Maps with Synonym Aggregation
Real-world data is rarely perfect. Your sales report might list “U.S.”, “USA”, and “United States” for the same country. Our Regional Map synonym feature is designed to handle this, and we've just made it far more powerful.
When grouping synonyms, the map might only display the data for the first synonym it found. This could lead to inaccurate totals.
With this release, TURBOARD aggregates (sums) the measures for all defined synonyms, ensuring your data is 100% accurate and saving you time on manual data prep. We've also ensured the map always displays the correct, official map label instead of just a synonym, keeping your visualizations clean and professional.
Watch our short video to explore the new enhancements for Regional Maps.

Stop building dashboards, and start getting answers. Experience the next era of BI with our leading GenAI capabilities ‒ request your personalized free demo today.