Irrigation and water use
Water consumption per hectare by field, zone and irrigation method, compared with previous seasons and with conventional irrigation.
TURBOARD brings sensor, irrigation, weather, soil analysis and field operation data into one governed model, so farming businesses and agricultural organisations see water use, crop development, costs and return on investment by field.
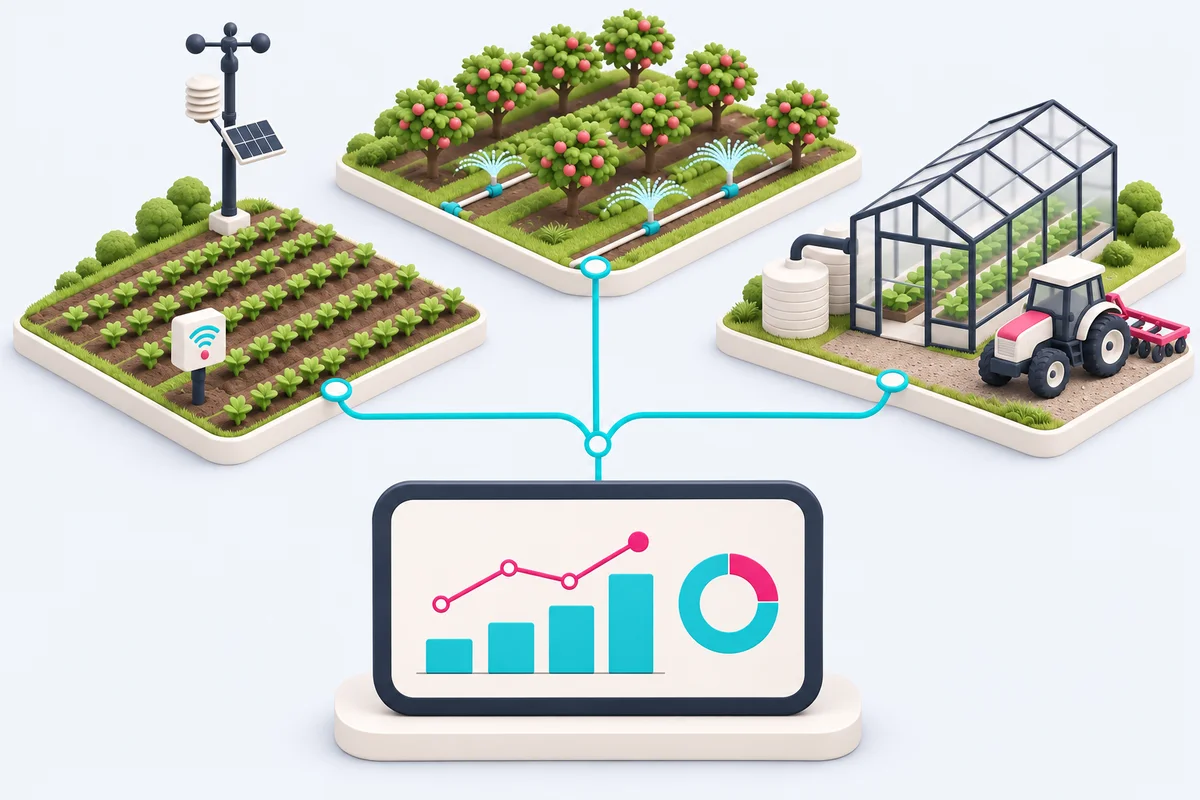
Climate variability, scarcer water, rising input costs and pressure on yields have made agriculture a data-driven business. Soil sensors, irrigation controllers, weather stations, drone surveys, machinery and farm management software all generate data — each in its own app. Comparing fields, seasons or irrigation systems still means exporting files and building spreadsheets, usually after the decision had to be made.
TURBOARD connects these sources in one model with field, crop, season and zone as shared dimensions. Water, fertiliser, energy and labour costs sit next to yield and soil readings, fields appear on maps with the GIS-S module, and investments in irrigation or other technology are judged by measured savings and payback rather than by vendor promises.
A user asks JAS how much water smart irrigation can save. JAS first finds the existing Smart Irrigation Control showcase built on 142 hectares of field data, then compares five irrigation systems on water savings, score and payback. The analysis ends on an action plan with investment, break-even and roll-out steps.
Water consumption per hectare by field, zone and irrigation method, compared with previous seasons and with conventional irrigation.
Soil moisture, pH and NPK readings by zone over time, with conditional formatting marking values outside the target range.
Yield per hectare by field, crop and variety, linked to inputs, weather and drone or satellite survey indices where available.
Temperature, rainfall and frost risk from weather data, shown against field operations and crop stages.
Water, fertiliser, energy, seed and labour costs per hectare and per tonne, compared across fields and seasons.
Investment, savings and payback of irrigation systems, sensors and machinery, with yield forecasts built in the ANA-S module.
Sensors, controllers, weather services and farm software each show their own dashboard.
All sources feed one governed model, so fields and seasons are compared with the same definitions.
Irrigation schedules follow routine rather than measured soil moisture and weather.
Soil readings, irrigation volumes and weather side by side by zone, as the data refreshes.
Investments in sensors or smart irrigation are hard to evaluate once installed.
Before-and-after water, energy and yield figures per field show the actual return on each investment.
Observations from the field arrive on paper or in messages and never reach the analysis.
With the FOR-S module, field teams record observations in forms whose data flows straight into the dashboards.
JAS, the AI assistant built into TURBOARD, answers from the same governed farm model as your dashboards. Ask in plain language and she first looks for an existing trusted showcase; if there is none, she writes the query and builds the chart. With JAS Explain, any dashboard comes with a written interpretation for the farm manager, the agronomist or the investor.
Explore JAS capabilities →We will connect a sample of your sensor, irrigation or cost data and show how TURBOARD and JAS help you decide where to act first.