
Scorecards (Performance Cards), one of the building blocks of data-driven organizations, cab be used to track the progress of a whole organization as well as its parts. Leaders can identify potential problems and make timely amendments before they become destructive.
What is a scorecard?
Above all, the scorecard is a management approach. Strategies are distilled into goals and goals into KPIs. KPIs are used to build TURBOARD scorecards (like dashlets are used to build dashboards). They can be linked to real-time data (utilized by the TURBOARD data model) or kept static for managers to fill periodically. See the sample scorecards at the bottom of the page.
Why are scorecards a valuable extension of classical dashboards?
| Dashboard | Scorecard | |
|---|---|---|
| Purpose of Usage |
|
|
| Measuring Method |
|
|
| Target Group |
|
|
| Data Update Period |
|
|
| Depth |
|
|
| Focus |
|
|
| Output |
|
|
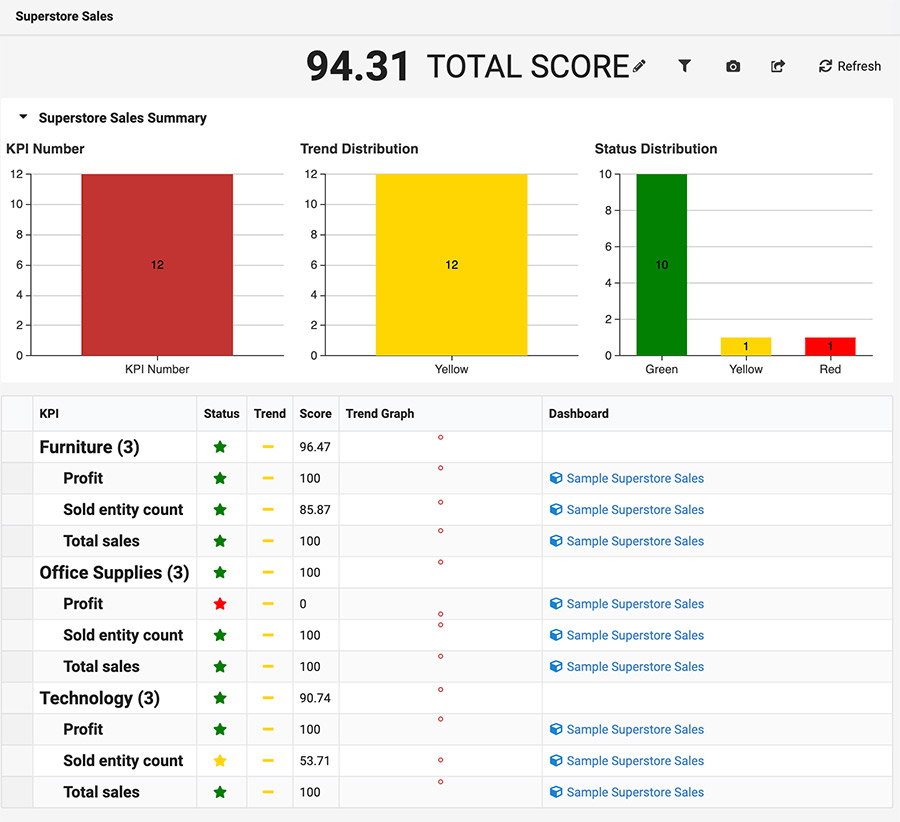
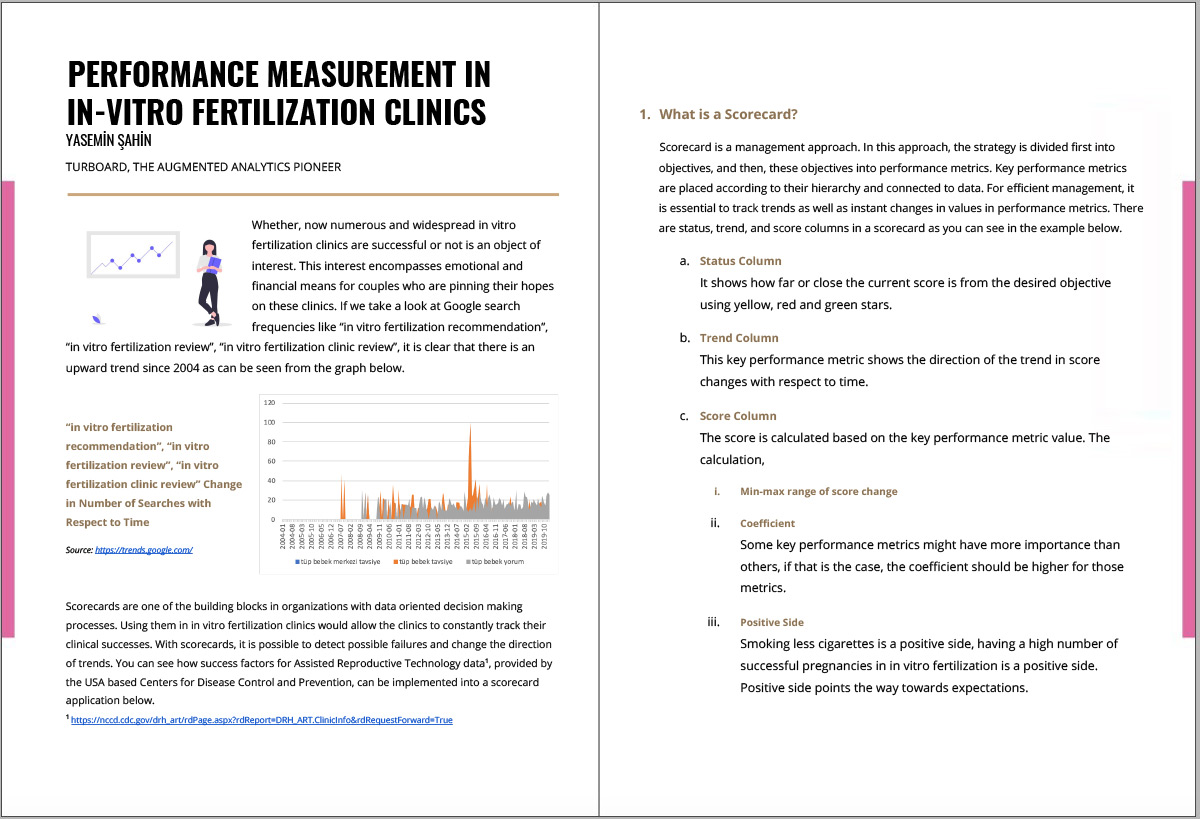
What are the Main Components of a Scorecard?
Status Column
Presents a normalized score with its success rate, using colors or icons (that can be changed in configuration).
Trend Column
Presents the latest change in score of a given KPI.
Score Column
The score is calculated with the value of KPIs in that group (or normalized/atomic value if it's leaf node).
Calculation
- Min-Max range.
- Weight: some KPIs are more important than others. You can adjust their relative importance by adjusting their weight.
- Aim direction: as an example, a lower smoking rate is better for health but a higher smoking rate is better for the profit of a tobacco company.
Sample 1: a scorecard showing a retail market performance.
Click the image below.
Sample 2: a scorecard raising questions about C-Sections.
Click the images below.

To reveal striking insights hidden in your own data, discover ![]()
DATA PROFESSIONALS
You need to produce report after another with perfect timing and all should be ready down to meticulous details.
We alleviate your burden with a platform providing a large toolset and with a team that will listen to your needs and be with you right at the moment not later on.
- Ease of use,
- Fanatical support,
- Data science tools bundled within the platform that will turn you into a distinguished data scientist.
MANAGERS
You invested in data for years, are you willing and ready to use it to reduce costs, increase revenue or to improve your processes? Are your current BI tools and the service that you get enough for your necessities and affordable?
Choose TURBOARD because:
- Make money through TURBOARD using favorable conditions on OEM licensing. Upsell your software with slick analytics,
- An established company with 80+ employees 15+ years experience implementing Business Intelligence and providing continuous services,
- No overpriced service fees, in addition to providing know-how transfer as much as possible to keep your team up-to-date,
- Get market and competitive intelligence to drive decision making via connection to open data sources,
- Reduced cost per user based on volumes which is unbeatable when it comes to hundreds of users.
Past
Since 2004, E-Kalite (producer of TURBOARD) has thrived on data monetization and visualization projects starting specifically on the pharmaceutical sector based in the USA. Since 2011, continuously being supported by the Turkish Science and Technology Agency (TUBITAK) and exempted from taxes in a renown university campus, we have built a decent business intelligence software.
Today
With more than 100 professionals, we are a flourishing team eager to work on your data needs. With our battle-proven software TURBOARD and expansive know-how, we are serving reputable institutions and companies.
Future
In our master-plan for 2022, we aim to attain the goal of augmented analytics within business intelligence. Tidbits of data may seem to appear random to even the most astute teams of experts. TURBOARD will use several data science methods interchangeably to different segments of data to reach an interesting pattern.
© 2004-2024 ![]() All Rights Reserved.
All Rights Reserved.