Check our 2021.04 bulletin. It’s all about TURBOARD’s geographical BI and mapping capabilities. You may also explore the full specs of our GIS-S below.
What is GIS?
A Geographic Information System (GIS) provides a toolset for visualizing and analyzing geo-spatial data. You can show data points in exact locations using visualizations that are most suited to a map.

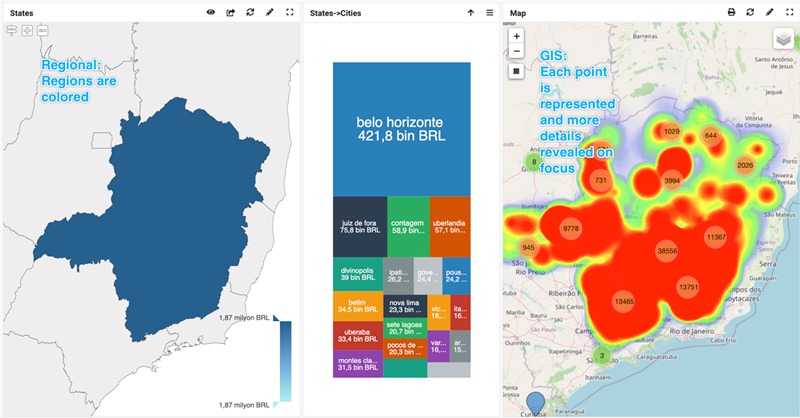
How is a GIS Dashlet Different from Regional Dashlets?
With a regular TURBOARD license you have regional visualization abilities. This gives you basic location intelligence, with the ability to drill down from state level to city level, and from city level down to suburb level, although this won't be enough when it comes to illuminating issues that are driven by geography. A GIS dashlet will show clustered or atomic point-of-interest data on top of layers and will work seamlessly with a geographical server engine.
Who Uses GIS?
Almost any industry can harness the potentials of the TURBOARD GIS module to effectively find map-based patterns affecting their business. Here are three examples:
-

Retail
- Use customer loyalty card data to map where your customers work, shop, and live.
- Use open data to see the demographics of the areas around your shops.
- Use this mix of data to determine the best location for your next shop.
Read more about TURBOARD solution package for grocery store chains and retail businesses.
-

Healthcare
- Track the spread of infectious diseases.
- Check the exact positions of your inventory items and concentrations of materials in different storerooms.
- Check hospital locations vs. patient home and work locations.
-

Government
- Municipalities may rely on citizen reports to pinpoint issues such as faulty street lamps and sewage problems. This data can be utilized to ensure services are delivered in a timely manner.
- Government officials can use GIS to track changes in total investment in different regions.
- GIS can be used for traffic route planning, determining population catchments, vegetation mapping, identifying landslide hazards, or mapping floodplains.
Geospatial Data Types
Longitude and latitude data can be used to utilize most of the GIS functionalities of TURBOARD. Some features will require native geospatial data types, such as shapes of postgreSQL or SDO_Geometry of Oracle. Spatial SQL queries will be functional in TURBOARD expressions.
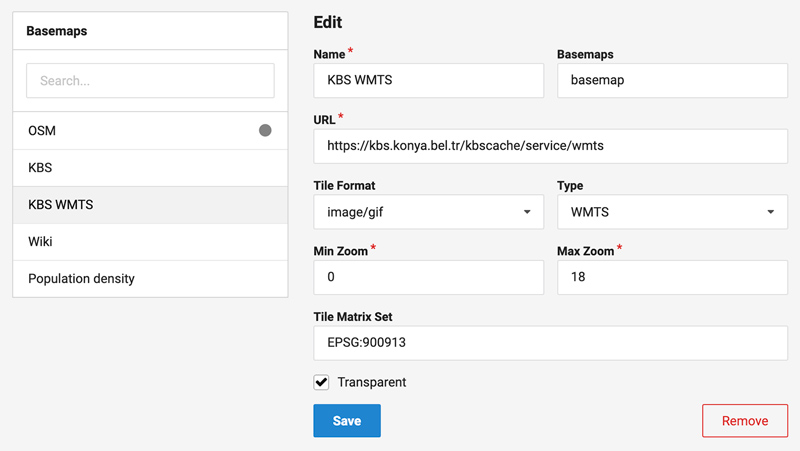
Basemaps
Basemaps are orthorectified images that form the background for a map. The GIS user can overlay data points over the selected basemap. This may be as simple as using a terrain type of openstreetmaps/Bing/Google/Baidu. The user may choose to embed a map which is the product of a map server such as QGIS or ArcGIS, in formats such as WMS/WMTS/PNG.
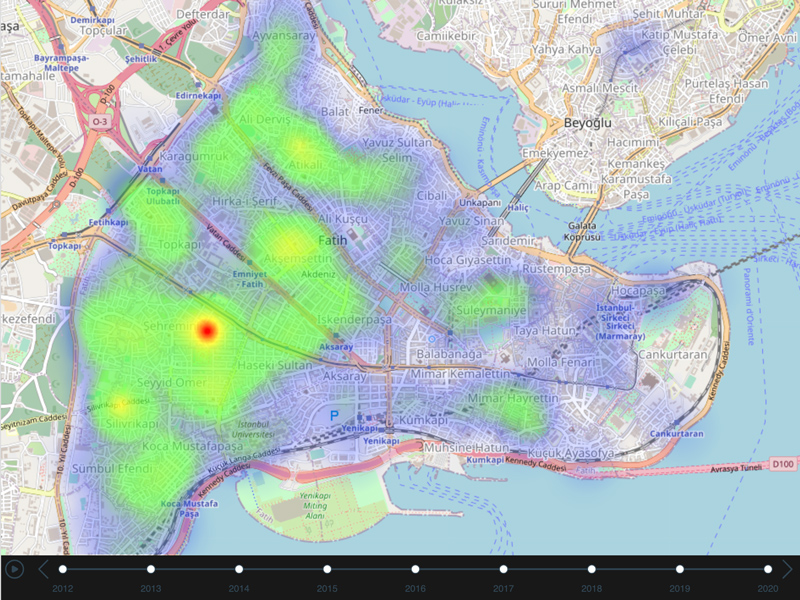
Heatmaps
A heatmap is a common GIS visual type that shows higher densities as hotspots on the map. A good color-coding system will be effective at highlighting problems and opportunities.
Clustered Pinmaps
In clustered pinmaps, large number of points are combined together to form a new marker with a number (number of pins). When you press a group marker it will auto-zoom to that area. Single pins will give exact information kept for that geospatial point. Coloring by dimension will work in single pins as well as group markers.

Polygons
Polygons can be employed as a native geospatial data type of database. You may plot lines and use polygons like a regional dashlet.
Layering
You can use different GIS dashlets on top of others and show a multi-layered dashlet on your dashboards. Layers are not limited to basemaps and can be applied on TURBOARD GIS dashlets.
(A sample GIS: Clustered Over Heatmap)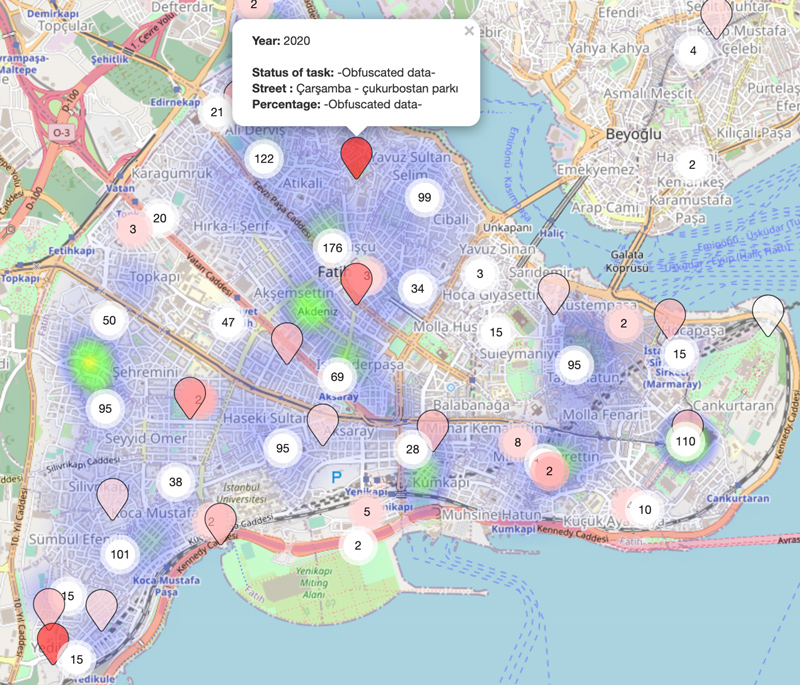
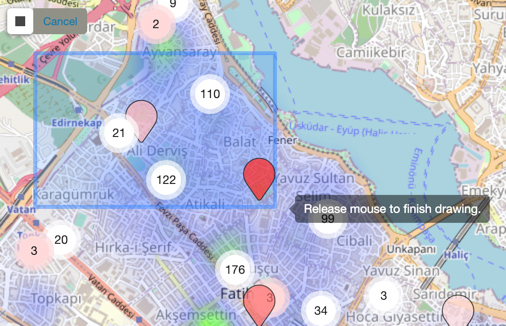
Filtering on a Map
You can filter by drawing a rectangle on the GIS dashlet. If native geospatial types are used, you can select by drawing circles.
To reveal striking insights hidden in your own data, discover ![]()
DATA PROFESSIONALS
You need to produce report after another with perfect timing and all should be ready down to meticulous details.
We alleviate your burden with a platform providing a large toolset and with a team that will listen to your needs and be with you right at the moment not later on.
- Ease of use,
- Fanatical support,
- Data science tools bundled within the platform that will turn you into a distinguished data scientist.
MANAGERS
You invested in data for years, are you willing and ready to use it to reduce costs, increase revenue or to improve your processes? Are your current BI tools and the service that you get enough for your necessities and affordable?
Choose TURBOARD because:
- Make money through TURBOARD using favorable conditions on OEM licensing. Upsell your software with slick analytics,
- An established company with 80+ employees 15+ years experience implementing Business Intelligence and providing continuous services,
- No overpriced service fees, in addition to providing know-how transfer as much as possible to keep your team up-to-date,
- Get market and competitive intelligence to drive decision making via connection to open data sources,
- Reduced cost per user based on volumes which is unbeatable when it comes to hundreds of users.
Past
Since 2004, E-Kalite (producer of TURBOARD) has thrived on data monetization and visualization projects starting specifically on the pharmaceutical sector based in the USA. Since 2011, continuously being supported by the Turkish Science and Technology Agency (TUBITAK) and exempted from taxes in a renown university campus, we have built a decent business intelligence software.
Today
With more than 100 professionals, we are a flourishing team eager to work on your data needs. With our battle-proven software TURBOARD and expansive know-how, we are serving reputable institutions and companies.
Future
In our master-plan for 2022, we aim to attain the goal of augmented analytics within business intelligence. Tidbits of data may seem to appear random to even the most astute teams of experts. TURBOARD will use several data science methods interchangeably to different segments of data to reach an interesting pattern.
© 2004-2024 ![]() All Rights Reserved.
All Rights Reserved.